Religion
Religious Demographics of Manchester, Greater Manchester, United Kingdom
Published
10 months agoon

Manchester is a city and metropolitan borough of Greater Manchester, England. It’s a lively city in England that’s home to people from all over the world. In 2011, it had a population of 503,127, and by 2021, it had grown to around 551,938 residents, with nearly 48,811 people moving in over the past ten years. The latest census tells us that Manchester is a place where many different religions are practiced. People follow beliefs like Christianity, Buddhism, Hinduism, Judaism, Islam, Sikhism, and others. This mix of religions shows how diverse Manchester is, with people from many backgrounds and cultures living together.
List of Religion in Manchester
The data player highlights significant changes in religious demographics for Manchester over the past decade, from 2011 to 2021, as highlighted by visual representations. These changes underscore the dynamic nature of the city's population and the evolving religious landscape. With noticeable alterations in population percentages among different religious groups, Manchester mirrors broader societal trends of religious diversity, secularization, and cultural transformation. An understanding of these changes offers valuable insights into the city's social dynamics and the experiences of its residents over time.
In 2021, 32.4% of Manchester residents identified as having "No religion," showing a significant increase from the 2011 figure of 25.3%. This rise of 7.1 percentage points stands out as the largest increase among all broad religious groups in Manchester over the past decade. This shift underscores the evolving religious landscape and the increasing diversity within the city.
Similarly, the Muslim community in Manchester has witnessed remarkable growth and prominence in recent years, contributing significantly to the city's cultural mosaic. With an increase from 79,496 (15.8%) in 2011 to 122,962 (22.3%) in 2021, Muslims have emerged as an integral part of Manchester's social fabric, establishing mosques, community centers, and educational institutions. This demographic transformation has not only enhanced the city's diversity but also facilitated interfaith dialogue and mutual understanding among its residents.
Year 2011
Year 2021
Conversely, the Christian population in Manchester has experienced a decline from 245,247 (48.7%) in 2011 to 199,873 (36.2%) in 2021. While Christianity continues to hold a significant presence in the city, this decrease reflects broader national trends of secularization and evolving religious preferences. Despite the decline in numbers, Christian churches and organizations remain vital pillars in Manchester's social, cultural, and charitable endeavors, contributing to the city's sense of community and unity.
While the Muslim and Christian populations in Manchester have undergone notable changes over the years, the numbers of other religious groups such as Hinduism, Judaism, Buddhism, and Sikhism remain relatively modest. Although these communities add to Manchester's religious diversity, they represent smaller percentages of the population compared to Muslims and Christians. Nonetheless, these religious groups also play valuable roles in enriching the city's social and cultural fabric, enhancing its overall vibrancy and diversity.
1. No Religion Surges
The “nones” are on the rise! No religion has seen a whopping 7.10% increase. More Manchester residents are opting for a secular path, questioning traditional beliefs.
2. Christians Decline
Church bells toll with a hint of melancholy. The Christian community has dwindled by 12.51%. Empty pews and shifting priorities mark this change.
3. Buddhists Hold Steady
Amid the hustle and bustle, Manchester’ Buddhist population remains unchanged at 0.40%. Serene temples continue to offer refuge.
4. Hindus Inch Forward
Hindus have nudged up by a mere 0.02%. Vibrant festivals and cultural ties keep their flame burning.
5. Jewish Community Holds Ground
Manchester’ Jewish community stands firm at 0.80%. Synagogues echo with tradition and resilience.
6. Muslims Flourish
The call to prayer resonates louder. Manchester’ Muslim population has surged by an impressive 6.48%. Mosques thrive as hubs of faith and community.
7. Sikhs Steady
Sikhs, with their turbans and warm smiles, remain constant at 1.20%. Their commitment to service shines bright.
8. Other Faiths Add Color
Manchester hosts a diverse mix of other religions, growing collectively by 0.12%. Temples, gurdwaras, and cultural exchanges enrich the city.
9. Religion Not Stated Fades
The enigmatic group who once kept their beliefs private has decreased by 0.98%. Perhaps openness now prevails.
In this evolving city, faith intertwines with progress, diversity, and introspection. Manchester, where old meets new, continues its spiritual journey. 🌟
Conclusion
In the latest census data from ONS.GOV for Manchester, significant shifts in religious demographics have emerged. The proportion of individuals identifying as Christian has experienced a notable decline of 12.51%, indicating a departure from previous trends within the city's religious landscape. Conversely, the Muslim population has seen a remarkable surge, with a substantial increase of 6.48%, highlighting the growing diversity of religious affiliations in Manchester. Additionally, while the percentage of those identifying with no religion has shown a significant uptick of 7.10%, the Hindu community has witnessed a modest growth of 0.02%. These findings underscore the dynamic and evolving nature of religious identification within Manchester, reflecting changing attitudes and demographic shifts over time.

You may like


The Rise of Asian Ethnic groups in 21st Century in the United Kingdom
-
Global Nuclear Warhead Distribution by Nation 2024
Religious Demographics of Yorkshire & The Humber by Constituency Area 2021
Religious Demographics of South East England by Constituency Area 2021
Religious Demographics of Wales by Constituency Area 2021
Religious Demographics of North West England by Constituency Area 2021

Religion
Mapped: What are the muslims population in Uttar Pradesh | State of India
Published
7 months agoon
August 2, 2024Uttar Pradesh, the most populous state in India, is home to approximately 200 million people. Muslims made up 19.26% of Uttar Pradesh’s total population in 2011, reflecting a slight increase from 18.4% in 2001. This state is divided into 75 districts, with Rampur standing out as a unique area where Muslims comprise more than 50% of the population.
Moradabad, Bijnor, Saharanpur, Muzaffarnagar, and Amroha are notable districts in Uttar Pradesh, where Muslims make up significant portions of the population—47.1%, 43%, 42%, 41.3%, and 40.8%, respectively.
1. Muslim population in Paschimi Uttar Pradesh
Paschimi(Western) Uttar Pradesh is a region in India that includes the western districts of the state, such as Rohilkhand. In this area, people commonly speak Hindi and Braj. The biggest city in the region is Ghaziabad, and the second biggest is Agra, which is a popular place for Taj Mahal, tourists to visit.
The total population of Paschimi(Western) Uttar Pradesh is 67,766,583 people. Out of this, 18,297,717 are Muslims, which means that Muslims make up 27% of the total population. This significant percentage highlights the diverse and multicultural nature of the region.
Agra has a Muslim population of 411,313, making up 9.31% of the total population, with the community playing a role in the city’s historical tourism and local industries.
Aligarh has a significant Muslim population of 729,283 (19.85%), known for its prestigious Aligarh Muslim University, which has been a center of Islamic learning and culture. In Ambedkar Nagar, Muslims make up 16.75% of the population (401,678), contributing to the local economy through agriculture and trade.
Auraiya has a smaller Muslim population of 101,963 (7.39%), primarily engaged in agriculture and local businesses.
Azamgarh is home to 718,692 Muslims, making up 15.58% of its population, with a rich history in Islamic education. In Baghpat, 364,583 Muslims constitute 27.98% of the population, playing a key role in the district’s agricultural sector.
Bahraich has a large Muslim population of 1,169,330 (33.53%), contributing to the district’s agricultural and cultural diversity. Ballia has 213,440 Muslims, representing 6.59% of the population, with the community engaged in farming and trade.
Balrampur has a high Muslim population percentage of 37.51% (805,975), contributing significantly to agriculture. Banda has a Muslim population of 157,612 (8.76%), with contributions to agriculture and local industries.
Barabanki has 737,106 Muslims (22.61%), playing a significant role in the district’s agriculture and trade. Bareilly has a substantial Muslim population of 1,536,534 (34.54%), with the community contributing to the city’s trade and cultural richness.
2. Muslim Population in Bundelkhand Region
Bundelkhand is a historic region in central India that spans seven districts in Uttar Pradesh: Jhansi, Jalaun, Lalitpur, Mahoba, Hamirpur, Banda, and Chitrakoot. Bundelkhand is surrounded by the Vindhyachal valleys and stretches across parts of Uttar Pradesh and Madhya Pradesh. People in this region speak a language called Bundeli.
The total population of Bundelkhand is 9,681,552 people. Among them, 694,041 are Muslims, which represents 7.16% of the overall population. This percentage indicates the presence of a significant Muslim community within the larger population.
Basti has a Muslim population of 364,510 (14.79%), primarily involved in agriculture. Bijnor has one of the highest Muslim populations in the state, with 1,585,210 Muslims making up 43.04% of the population, contributing to local agriculture and trade.
Budaun has 790,515 Muslims (21.47%), with the community involved in farming and local businesses. Bulandshahr has a Muslim population of 777,407 (22.22%), playing a significant role in the district’s agricultural and industrial sectors.
Chandauli has 215,081 Muslims (11.01%), with the community engaged in local trade and farming. Chitrakoot has a small Muslim population of 34,559 (3.48%), contributing to agriculture and local businesses.
Deoria has 358,539 Muslims (11.56%), primarily involved in agriculture. Etah has a Muslim population of 146,346 (8.25%), with contributions to agriculture and trade. Etawah has 113,961 Muslims (7.2%), engaged in agriculture and local industries.
Faizabad, now known as Ayodhya, has a Muslim population of 365,806 (14.8%), contributing to local trade and agriculture. Farrukhabad has 276,846 Muslims (14.69%), involved in agriculture and local businesses.
Fatehpur has a Muslim population of 350,700 (13.32%), contributing to the district’s agricultural economy. Firozabad has 314,812 Muslims (12.6%), with the community playing a role in the local glass industry.
Gautam Buddh Nagar has 215,500 Muslims (13.08%), contributing to the district’s growing industrial and commercial sectors. Ghaziabad has a substantial Muslim population of 1,186,776 (25.35%), with contributions to the city’s trade and industry.
3. Muslim Population in Awadh Region
Awadh is a significant historical region located in northern India, currently forming the northeastern part of Uttar Pradesh. The name ‘Awadh’ is derived from Ayodhya, an ancient city that served as the capital of the kingdom of Kosala. Awadh is considered the homeland of the Hindu deity Rama, who is believed to be the earthly incarnation of Vishnu. This kingdom’s borders largely align with the present-day region of Awadh. In the 12th century, Muslim invaders took control of Awadh, and by the 16th century, it was integrated into the Mughal Empire, marking an important chapter in its history.
In the heart of northern Uttar Pradesh, the Awadh region is home to Awadhi, an Indo-Aryan language also known as Audhi. This language is deeply rooted in the area’s cultural and historical landscape.
The total population of the area is 39,843,170 people. Out of this number, 6,420,140 are Muslims, which represents 16.11% of the overall population. This proportion highlights a significant Muslim community within the region, reflecting its diverse demographic makeup.
Ghazipur has 368,153 Muslims (10.17%), involved in agriculture and local businesses. Gonda has a Muslim population of 678,615 (19.76%), contributing to the district’s agricultural output.
Gorakhpur has 403,847 Muslims (9.09%), engaged in local trade and agriculture. Hamirpur has a smaller Muslim population of 91,269 (8.26%), with the community involved in agriculture.
Hardoi has a Muslim population of 556,219 (13.59%), contributing to local trade and agriculture. Jalaun has 171,581 Muslims (10.15%), involved in agriculture and small businesses.
Jaunpur has 483,750 Muslims (10.76%), contributing to the district’s cultural and agricultural landscape. Jhansi has a Muslim population of 147,842 (7.4%), contributing to local trade and agriculture.
Jyotiba Phule Nagar (Amroha) has a large Muslim population of 750,368 (40.78%), engaged in agriculture and trade, with a rich cultural heritage. Kannauj has 273,967 Muslims (16.54%), known for their contributions to the perfume industry and local businesses.
Kanpur Dehat has a Muslim population of 176,327 (9.82%), engaged in agriculture and local trade. Kanpur Nagar has 720,660 Muslims (15.73%), contributing to the city’s industrial, trade, and educational sectors.
Kanshiram Nagar has 213,822 Muslims (14.88%), involved in agriculture and local industries. Kaushambi has a Muslim population of 220,423 (13.78%), contributing to agriculture and trade.
Kheri has a large Muslim population of 807,600 (20.08%), engaged in agriculture, particularly in sugarcane production. Kushinagar has 620,244 Muslims (17.4%), contributing to agriculture and trade in this culturally significant district.
Lalitpur has the smallest Muslim population in the state, with 33,724 Muslims (2.76%) involved in agriculture and small businesses.
Lucknow has a vibrant Muslim community of 985,070 (21.46%), involved in various sectors including trade, education, and politics, with the city known for its rich Mughal history. Mahamaya Nagar has 159,448 Muslims (10.19%), contributing to local trade and agriculture.
Mahoba has 57,454 Muslims (6.56%), with a focus on agriculture and small-scale trade. Mahrajganj has 458,650 Muslims (17.08%), engaged in agriculture, especially in sugarcane production.
Mainpuri has 100,723 Muslims (5.39%), contributing to local agriculture and trade. Mathura has 216,933 Muslims (8.52%), involved in trade and agriculture in this city of religious importance.
4. Muslims in Purvanchal Uttar Pradesh
Purvanchal is in the eastern part of Uttar Pradesh, India, and has a long history. It is part of the bigger Bhojpuri region and mainly includes areas where people speak Bhojpuri. This region is known for its rich culture and traditions.
Varanasi, often referred to as the spiritual city, is seen as the heart of Purvanchal. It is regarded as the central city in this eastern region of Uttar Pradesh. If Purvanchal were to become a separate state, Varanasi would be its capital.
The total population of Purvanchal is 50,271,498(5 crore) people. Among them, 6,836,150(68 Lakh) are Muslims, which represents 13.59% of the total population. This indicates that a significant portion of the population practices Islam, contributing to the area’s diverse cultural and social landscape.
Mau has 428,555 Muslims (19.43%), contributing to agriculture and local trade in a district with a rich cultural heritage. Meerut has a large Muslim population of 1,185,643 (34.43%), contributing to the city’s commerce, education, and historical significance.
Mirzapur has 195,765 Muslims (7.84%), engaged in agriculture and local trade, with the district known for its carpets and brassware industries.
Moradabad has the largest Muslim population in the state, with 2,248,392 Muslims (47.12%) driving the district’s brassware industry.
Muzaffarnagar has 1,711,453 Muslims (41.3%), contributing significantly to the district’s agricultural output. Pilibhit has 489,686 Muslims (24.11%), involved in agriculture, particularly sugarcane and rice cultivation.
Pratapgarh has a Muslim population of 452,394 (14.1%), contributing to agriculture and local businesses.
Prayagraj formally named Allahabad, has a significant Muslim population of 796,756 (13.38%), with the city being a major religious and educational center.
Rae Bareli has 413,243 Muslims (12.13%), contributing to local agriculture and trade in a district known for its political significance.
Rampur has the highest percentage of Muslims in the state, with 1,181,337 Muslims (50.57%) contributing to the district’s cultural heritage, including the historic Rampur Raza Library. Saharanpur has a large Muslim population of 1,454,052 (41.95%), with the district being a key center for Islamic education and wood carving industry.
Sant Kabir Nagar has 404,410 Muslims (23.58%), involved in agriculture and local trade, with the district named after the famous saint Kabir. Sant Ravidas Nagar (Bhadohi) has 203,887 Muslims (12.92%), contributing to the district’s renowned carpet industry.
Shahjahanpur has a Muslim population of 527,581 (17.55%), contributing to agriculture and local businesses. Shrawasti has 343,981 Muslims (30.79%), involved in agriculture and local trade in a district known for its ancient Buddhist ruins.
Siddharthnagar has 748,073 Muslims (29.23%), engaged in agriculture and local industries, with the district having historical significance related to Buddhism. Sitapur has 893,725 Muslims (19.93%), contributing to agriculture and local trade in a district known for its traditional industries.
Sonbhadra has a smaller Muslim population of 103,567 (5.56%), contributing to agriculture and local businesses in this district known for its natural resources. Sultanpur has 650,261 Muslims (20.92%), contributing significantly to agriculture and trade in a district known for its vibrant cultural traditions.
Unnao has 363,453 Muslims (11.69%), engaged in agriculture and local businesses in a district with historical significance.
Varanasi, one of the oldest cities in the world, has 546,987 Muslims (14.88%), contributing to the city’s rich cultural and religious tapestry, with the city being a major center for Islamic scholarship and trade.
The Muslim population in Uttar Pradesh is distributed across its various regions, each with its own unique demographic makeup. In Purvanchal, Muslims constitute 13.59% of the population, with a total of 6,836,150 people. Awadh, another significant region, has 6,420,140 Muslims, making up 16.11% of its population. Bundelkhand, known for its historical significance, has a smaller Muslim community, comprising 7.16% of the population, with 694,041 people. In contrast, Paschimi Uttar Pradesh (Western UP) has the largest Muslim population, with 18,297,717 individuals, representing 27% of the region’s total population. These statistics reflect the diverse and intricate social fabric of Uttar Pradesh, where different communities coexist, each contributing to the state’s cultural richness.
Information
Copyright: © 2024 Data Player
*Note: Hover or click on each districts region to get full corresponding details. A box with details will appear a little bit down the map.
Data source: Uttar Pradesh Census 2011
This webpage provides information on Muslim population in Uttar Pradesh by its district in numbers as well as percentage and uses various technologies for its functionality.
The following tools and technologies were used:
* HTML and CSS for the webpage structure and styling
* JavaScript for interactive features
* External data sources for statistics
Religion
Mapped: What is Muslim Population in West Bengal by District wise 2011
Published
7 months agoon
July 27, 2024West Bengal is home to more than 24.6 million Muslims, which accounts for about 27% of the state’s total population from Census 2011. Most of these Muslims are ethnic Bengali, with their numbers exceeding 22 million. Within this diverse state, Muslims are recognized as the largest minority community, meaning they have the highest population among all non-Hindu groups. This makes them a significant and influential part of West Bengal’s demographic landscape. Muslims play a crucial role in the political landscape of West Bengal, significantly influencing the outcome of elections and the success of political parties. Their substantial numbers and voting power make them a key demographic that parties cannot afford to overlook. Specifically, the All India Trinamool Congress (AITC) has often relied on the support of Muslim voters to secure victories in various elections.
Muslims population are visualised through map, bar chart and data table in the following.
District
Murshidabad
In Murshidabad, Muslims form the majority, constituting about 66.88% of the district’s population. With a total population of 7,103,807 people, this translates to a substantial Muslim community of approximately 4,707,573 individuals. The high percentage reflects Murshidabad’s significant Muslim presence and influence in the region.
South 24 Parganas
South 24 Parganas has a Muslim population of around 35.57%, which is a notable portion of its total population of 8,161,961. This results in a Muslim community of about 2,903,075 people. This district’s diverse demographic highlights the substantial role Muslims play in the local community and its socio-economic dynamics.
North 24 Parganas
In North 24 Parganas, Muslims make up 25.82% of the population. With the district’s total population reaching 10,009,781, this percentage corresponds to approximately 2,584,684 Muslims. The Muslim community here is a significant minority, contributing to the district’s cultural and demographic diversity.
Malda
Malda’s Muslim population constitutes 51.27% of its residents. With a total population of 3,988,845, this equates to roughly 2,045,151 Muslims. This substantial Muslim demographic underscores Malda’s role as a key area with a significant Muslim presence in West Bengal.
Paschim Bardhaman
In Paschim Bardhaman, Muslims account for 13.32% of the district’s total population. Out of a total population of 2,882,031, this results in approximately 384,027 Muslims. This smaller percentage reflects a relatively modest but still important Muslim community in the district.
Uttar Dinajpur
Uttar Dinajpur has a Muslim population of 49.92%, almost half of the district’s total population. With a total of 3,007,134 people, this translates to about 1,501,170 Muslims. This significant percentage highlights the strong presence and influence of Muslims in this region.
Nadia
In Nadia, Muslims represent 26.76% of the population. The district’s total population is 5,167,600, which includes around 1,382,682 Muslims. This demographic detail illustrates Nadia’s diverse population and the important role of Muslims within the district.
Birbhum
Birbhum’s Muslim population stands at 37.06%, making it a substantial minority within the district. With a total population of 3,502,404, this percentage amounts to approximately 1,298,054 Muslims. The significant Muslim presence reflects their vital role in Birbhum’s local communities.
Howrah
In Howrah, Muslims make up 26.20% of the total population. With the district’s population at 4,850,029, this equates to around 1,270,641 Muslims. The presence of a large Muslim community in Howrah contributes to the district’s rich cultural and social landscape.
Kolkata
Kolkata has a Muslim population of 20.60%, which is a notable minority in the city. Out of a total population of 4,496,694, this translates to approximately 926,414 Muslims. Despite being a minority, the Muslim community plays a significant role in Kolkata’s diverse urban environment.
Hooghly
In Hooghly, Muslims constitute 15.77% of the population. With a total of 5,519,145 people, this results in a Muslim population of around 870,204. This percentage indicates a substantial Muslim presence within Hooghly, contributing to the district’s diversity.
Purba Medinipur
Purba Medinipur has a Muslim population of 14.59%. Out of the district’s total population of 5,095,875, this amounts to approximately 743,436 Muslims. This relatively moderate percentage highlights the significant but not majority status of Muslims in Purba Medinipur.
Cooch Behar
In Cooch Behar, Muslims make up 26.54% of the district’s population. With a total of 2,819,086 people, this translates to about 720,033 Muslims. This proportion indicates a notable Muslim community that contributes to the district’s demographic diversity.
Paschim Medinipur
Paschim Medinipur has a Muslim population of 10.49%, which is a smaller percentage compared to other districts. With a total population of 5,913,457, this corresponds to approximately 620,554 Muslims. This percentage reflects a moderate Muslim presence in the district.
Jalpaiguri
Jalpaiguri’s Muslim population constitutes 11.51% of the district’s total. With 3,872,846 people in the district, this results in approximately 445,817 Muslims. Although a minority, Muslims in Jalpaiguri are a notable part of the district’s demographic composition.
Dakshin Dinajpur
In Dakshin Dinajpur, Muslims represent 24.63% of the population. The district’s total population of 1,676,276 includes about 412,788 Muslims. This percentage reflects a significant Muslim presence, influencing the local demographic and cultural landscape.
Bankura
Bankura has a Muslim population of 8.08%, which is relatively small. With a total population of 3,596,674, this translates to approximately 290,450 Muslims. Despite being a minority, Muslims in Bankura contribute to the district’s social fabric.
Purulia
In Purulia, Muslims make up 7.76% of the population. With a total of 2,930,115 people, this amounts to around 227,249 Muslims. This smaller percentage indicates a modest but present Muslim community in the district.
| Countries | Total | Deployed |
|---|---|---|
| United States | 5,044 | 1,770 |
| Russian Federation | 5,580 | 1,710 |
| United Kingdom | 225 | 120 |
| France | 290 | 280 |
| China | 500 | 24 |
| India | 172 | 0 |
| Pakistan | 170 | 0 |
| Israel | 90 | 0 |
| North Korea | 50 | 0 |
Darjeeling
Darjeeling’s Muslim population is quite small at 5.69%. With a total population of 1,846,823, this corresponds to approximately 105,086 Muslims. This reflects a minor Muslim presence in the district, with the community being a small part of the overall demographic.
Purba Bardhaman
Purba Bardhaman has a Muslim population of 25.14%. Out of the district’s total population of 4,835,532, this translates to about 1,215,737 Muslims. This significant percentage underscores the considerable presence of Muslims in Purba Bardhaman.
Alipurduar
In Alipurduar, Muslims constitute 8.74% of the population. With a total population of 1,491,250, this results in approximately 130,339 Muslims. This relatively small percentage reflects a modest Muslim presence in the district.
Kalimpong
Kalimpong has a very small Muslim population of 1.59%. Out of a total population of 251,642, this translates to around 3,998 Muslims. This minimal percentage indicates that Muslims are a very small minority in Kalimpong.
Information
Copyright: © 2024 Data Player
*Note: Hover or click on each districts region to get full corresponding details. A box with details will appear a little bit down the map.
Data source: Wikipedia
This webpage provides information on Muslim population in West Bengal by its district in numbers as well as percentage and uses various technologies for its functionality.
The following tools and technologies were used:
* HTML and CSS for the webpage structure and styling
* JavaScript for interactive features
* External data sources for statistics
Religion
Mapped: What is Muslim Population in India by its State | Census 2011
Published
7 months agoon
July 26, 2024Islam is the second-largest religion in India, with about 14.2% of the population—around 172.2 million people—identifying as Muslim, based on the 2011 census. This makes India home to the third-largest Muslim population in the world.
The majority of Indian Muslims are Sunni, while Shia Muslims account for about 15% of the Muslim population. Indian Muslims contribute significantly to the country’s cultural and social fabric, with a rich history of influence in arts, science, and politics.
Politically, Muslims in India have a notable presence. They participate in various political parties and have their own organizations advocating for their rights and interests. Historically, political issues concerning Muslims in India have included debates over religious representation, minority rights, and socio-economic development. The Muslim community’s voting power and political preferences can significantly impact elections and policy decisions at both state and national levels.
Lakshadweep: With a Muslim population of 96.58%, Lakshadweep is a predominantly Muslim territory, showcasing a unique cultural and religious unity. This majority status could lead to enhanced focus on policies that cater specifically to the needs and interests of the Muslim community in the future.
Jammu and Kashmir: Home to 68.31% Muslims, Jammu and Kashmir’s demographic landscape is significantly shaped by its Muslim majority. Future developments might emphasize regional autonomy and tailored governance to address the aspirations of this major demographic.
Assam: With 34.22% of its population being Muslim, Assam represents a significant demographic shift in the northeastern region. This growing Muslim population could influence local politics and contribute to the state’s evolving socio-cultural environment.
West Bengal: The 27.01% Muslim population in West Bengal plays a crucial role in its social and political dynamics. The state’s future might see increased focus on policies that address the needs of this significant community, influencing both economic and educational developments.
| State | Bar | Muslim Population |
|---|---|---|
| Lakshadweep | 0.062 M | 0.062 M |
| Jammu and Kashmir | 8.567 M | 8.567 M |
| Assam | 10.679 M | 10.679 M |
| West Bengal | 24.655 M | 24.655 M |
| Kerala | 8.873 M | 8.873 M |
| Uttar Pradesh | 38.484 M | 38.484 M |
| Bihar | 17.558 M | 17.558 M |
| Jharkhand | 4.794 M | 4.794 M |
| Uttarakhand | 1.407 M | 1.407 M |
| Karnataka | 7.893 M | 7.893 M |
| Delhi | 2.159 M | 2.159 M |
| Maharashtra | 12.971 M | 12.971 M |
| Gujarat | 5.847 M | 5.847 M |
| Andhra Pradesh | 7.139 M | 7.139 M |
| Tamil Nadu | 10.214 M | 10.214 M |
| Punjab | 1.692 M | 1.692 M |
| Haryana | 1.925 M | 1.925 M |
| Chhattisgarh | 3.163 M | 3.163 M |
| Himachal Pradesh | 0.393 M | 0.393 M |
| Manipur | 0.239 M | 0.239 M |
| Meghalaya | 0.547 M | 0.547 M |
| Nagaland | 0.131 M | 0.131 M |
| Sikkim | 0.169 M | 0.169 M |
| Tripura | 0.303 M | 0.303 M |
| Arunachal Pradesh | 0.158 M | 0.158 M |
Kerala: In Kerala, 26.56% of the population is Muslim, contributing to the state’s diverse cultural fabric. This significant presence is likely to impact future educational and healthcare policies, reflecting the community’s substantial role in the state’s development.
Uttar Pradesh: With 19.26% of its population being Muslim, Uttar Pradesh’s large Muslim demographic is a key factor in its political and social landscape. Future trends might see an increased emphasis on inclusive policies and development programs tailored to this significant group.
Bihar: Bihar’s Muslim population of 16.87% is an important demographic group in the state. The future might bring enhanced focus on community-driven initiatives and programs designed to address the needs and opportunities for this significant minority.
Jharkhand: Muslims make up 14.53% of Jharkhand’s population, a minority but still a noteworthy presence. As the state develops, future policies might aim to better integrate and address the needs of this community.
Uttarakhand: With a Muslim population of 13.95%, Uttarakhand’s Muslim community represents a minority but contributes to the state’s cultural diversity. Future trends might focus on fostering inclusive development and social harmony.
Karnataka: Muslims constitute 12.92% of Karnataka’s population. As the state progresses, there could be increasing efforts to incorporate the interests and needs of this community into broader state policies and development strategies.
Delhi: In Delhi, Muslims make up 12.86% of the population. The capital’s diverse demographic profile could lead to future policies that enhance social services and community engagement for this group.
Maharashtra: With 11.54% of its population being Muslim, Maharashtra’s significant Muslim community is likely to play an influential role in shaping future socio-political and economic policies.
Gujarat: Muslims represent 9.67% of Gujarat’s population. This minority presence might see future policies aimed at better integration and addressing specific community needs in the state’s development plans.
Andhra Pradesh: At 9.56%, the Muslim population in Andhra Pradesh is a notable minority. Future developments might include initiatives focused on improving socio-economic conditions and community participation.
Rajasthan: Rajasthan’s 9.07% Muslim population contributes to the state’s diverse cultural tapestry. Future policies may focus on enhancing community development and addressing the unique needs of this demographic.
Tripura: With 8.60% of its population being Muslim, Tripura’s minority group might see targeted policies aimed at fostering inclusion and supporting community development in the future.
Andaman and Nicobar Islands: Muslims make up 8.52% of the population in this union territory. Future trends may involve initiatives to better integrate and support this minority community within the broader socio-economic framework.
Manipur: The 8.40% Muslim population in Manipur, though a minority, contributes to the region’s cultural diversity. Future policies might aim at improving community engagement and support.
Goa: With 8.33% of its population being Muslim, Goa’s small but significant Muslim community may influence future social and cultural initiatives aimed at enhancing community welfare.
Daman and Diu: Muslims represent 7.92% of the population in Daman and Diu. Future development might focus on ensuring the inclusion and integration of this minority group into broader socio-economic plans.
Haryana: The Muslim population in Haryana is 7.03%. As the state evolves, future policies might address the specific needs of this minority community to promote inclusive development.
Madhya Pradesh: At 6.57%, the Muslim population in Madhya Pradesh is a minority, but future strategies may include initiatives aimed at improving socio-economic conditions and community support.
Puducherry: With 6.05% of its population being Muslim, Puducherry might see future developments focused on integrating and addressing the needs of this minority community within its broader socio-economic framework.
Tamil Nadu: The Muslim population in Tamil Nadu is 5.86%. Future policies may focus on enhancing community welfare and addressing specific needs of this demographic group.
Chandigarh: Muslims make up 4.87% of Chandigarh’s population. Although a minority, future policies might focus on ensuring their inclusion and addressing their community needs.
Meghalaya: With 4.40% of its population being Muslim, Meghalaya’s minority group might see future efforts aimed at promoting inclusivity and community support.
Dadra and Nagar Haveli: Muslims constitute 3.76% of the population in Dadra and Nagar Haveli. Future developments might include initiatives to support and integrate this small but significant community.
Nagaland: At 2.47%, the Muslim population in Nagaland is a minority, with future trends possibly focusing on ensuring community inclusion and support.
Population of Muslims Dataset by Indian State
| State | Total Population | Muslim Population | Muslim % |
|---|---|---|---|
| Lakshadweep | 64,473 | 62,268 | 96.58% |
| Jammu and Kashmir | 12,541,302 | 8,567,485 | 68.31% |
| Assam | 31,205,576 | 10,679,345 | 34.22% |
| West Bengal | 91,276,115 | 24,654,825 | 27.01% |
| Kerala | 33,406,061 | 8,873,472 | 26.56% |
| Uttar Pradesh | 199,812,341 | 38,483,967 | 19.26% |
| Bihar | 104,099,452 | 17,557,809 | 16.87% |
| Jharkhand | 32,988,134 | 4,793,994 | 14.53% |
| Uttarakhand | 10,086,292 | 1,406,825 | 13.95% |
| Karnataka | 61,095,297 | 7,893,065 | 12.92% |
| Delhi | 16,787,941 | 2,158,684 | 12.86% |
| Telangana | 39,500,000 | 5,012,000 | 12.68% |
| Maharashtra | 112,374,333 | 12,971,152 | 11.54% |
| Gujarat | 60,439,692 | 5,846,761 | 9.67% |
| Andhra Pradesh | 84,580,777 | 8,082,412 | 9.56% |
| Rajasthan | 68,548,437 | 6,215,377 | 9.07% |
| Tripura | 3,673,917 | 316,042 | 8.60% |
| Andaman and Nicobar Islands | 380,581 | 32,413 | 8.52% |
| Manipur | 2,855,794 | 239,836 | 8.40% |
| Goa | 1,458,545 | 121,564 | 8.33% |
| Daman and Diu | 243,247 | 19,277 | 7.92% |
| Haryana | 25,351,462 | 1,781,342 | 7.03% |
| Madhya Pradesh | 72,626,809 | 4,774,695 | 6.57% |
| Puducherry | 1,247,953 | 75,556 | 6.05% |
| Tamil Nadu | 72,147,030 | 4,229,479 | 5.86% |
| Chandigarh | 1,055,450 | 51,447 | 4.87% |
| Meghalaya | 2,966,889 | 130,399 | 4.40% |
| Dadra and Nagar Haveli | 343,709 | 12,922 | 3.76% |
| Nagaland | 1,978,502 | 48,963 | 2.47% |
| Himachal Pradesh | 6,864,602 | 149,881 | 2.18% |
| Orissa | 41,974,218 | 911,670 | 2.17% |
| Chhattisgarh | 25,545,198 | 514,998 | 2.02% |
| Arunachal Pradesh | 1,383,727 | 27,045 | 1.95% |
| Punjab | 27,743,338 | 535,489 | 1.93% |
| Sikkim | 610,577 | 9,867 | 1.62% |
| Mizoram | 1,097,206 | 14,832 | 1.35% |
Himachal Pradesh: Muslims represent 2.18% of Himachal Pradesh’s population. Future policies might aim at fostering inclusivity and addressing the needs of this minority group.
Orissa: With 2.17% Muslim population, Orissa’s minority group may see future initiatives aimed at promoting community welfare and integration.
Chhattisgarh: The Muslim population in Chhattisgarh is 2.02%. Future developments might focus on addressing the needs of this minority community and promoting inclusive growth.
Arunachal Pradesh: Muslims make up 1.95% of Arunachal Pradesh’s population. Future strategies might include efforts to enhance community support and inclusion.
Punjab: At 1.93%, the Muslim population in Punjab is a minority. Future policies may focus on promoting inclusivity and addressing the needs of this community.
Sikkim: With 1.62% of its population being Muslim, Sikkim’s minority group might see future developments aimed at fostering community engagement and support.
Mizoram: Muslims represent 1.35% of Mizoram’s population. Future trends may focus on integrating this minority community and addressing their specific needs.
Information
Copyright: © 2024 Data Player
*Note: Hover or click on country’s state to get full details. A box with details will appear a little bit down the map.
Data source: census2011
This webpage provides information on Muslim population in India by its states in numbers as well as percentage and uses various technologies for its functionality.
The following tools and technologies were used:
* HTML and CSS for the webpage structure and styling
* JavaScript for interactive features
* External data sources for statistics
Trending
- Economy2 years ago
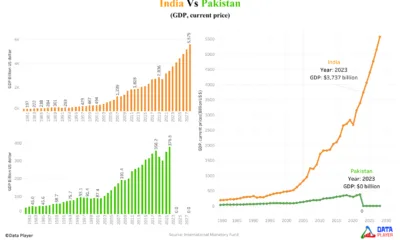
Why Pakistan’s economy is drowning while India’s economy is touching the sky
- Religion7 months ago
Mapped: What are the muslims population in Uttar Pradesh | State of India
- Technology1 year ago
Highest number of software developers by country in the world 2023 by GitHub | Data Player
- Demographics7 months ago
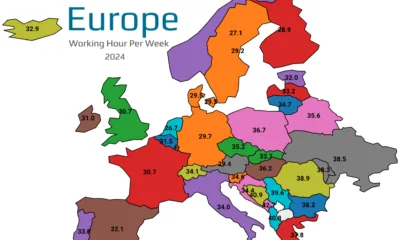
Mapped: Average Working Hours by European Countries in 2024
- Superpower countries7 months ago
Global Nuclear Warhead Distribution by Nation 2024
- Demographics2 years ago
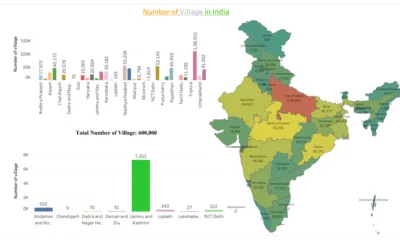
What are the Number of Villages in India by its State and Union Territory
- Demographics2 years ago
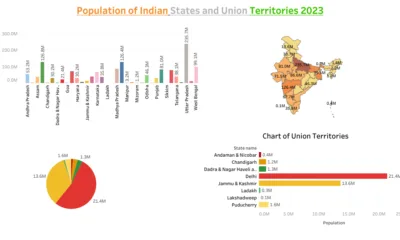
Massive population size by Indian states 2023
- Demographics2 years ago
Ranked: Highest Populated Countries (2023)