Economy
Millionaires are leaving their countries in 2024 why?
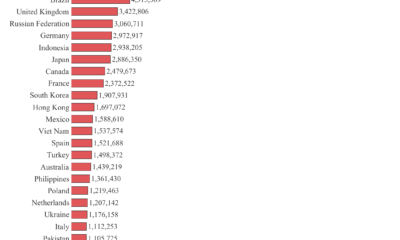
| Country | Bar | Outflows |
|---|---|---|
 China
China | -15,200 | -15,200 |
 United Kingdom
 | -9,500 | -9,500 |
 India
India | -4,300 | -4,300 |
 South Korea
 | -1,200 | -1,200 |
 Russian Federation
 | -1,000 | -1,000 |
 Brazil
 | -800 | -800 |
 South Africa
 | -600 | -600 |
 Taiwan (Chinese Taipei)
 | -400 | -400 |
 Nigeria
 | -300 | -300 |
 Vietnam
 | -300 | -300 |
China is expected to see the most millionaires leaving the country this year, with a whopping 15,200 predicted to move out. The UK is next in line to lose 9,500 millionaires by the end of 2024, followed by India with an expected loss of 4,300 millionaires. This trend shows that many wealthy people are choosing to relocate, possibly due to changes in the economy, society, politics, life style and tax.
For many years, London has been a top choice for millionaires moving from Europe, Africa, Asia, and the Middle East. However, things have changed in the last decade. More millionaires are now leaving the UK than coming in. After Brexit, from 2017 to 2023, the UK lost 16,500 millionaires. The outlook for 2024 is also concerning, with a projected net loss of 9,500 millionaires in just one year. This shift suggests big changes ahead for London’s economy and population. This trend is driven by a combination of Brexit fallout, political uncertainty, and controversial changes to the non-domicile tax rules. As a result, the UK is losing its appeal as a destination for wealthy individuals, signaling challenging times ahead for its economic and political landscape.
India is expected to see a notable decline of 4,300 millionaires leaving the country this year. Although this number is lower than the 5,100 who departed in 2023, India continues to rank among the leading countries for high-net-worth individuals (HNWIs) moving abroad. Indian millionaires frequently leave the subcontinent in search of a better quality of life, safer and cleaner environments, and access to higher-quality health and education services. These motivations drive many affluent individuals to relocate abroad, seeking opportunities that enhance their overall well-being and that of their families.
China is experiencing significant net outflows of millionaires (15200) due to its robust economy creating many new wealthy individuals. However, the slowdown in wealth growth in China in recent years suggests that these ongoing losses could have increasingly negative effects over time.


| Country | Bar | Inflows |
|---|---|---|
 United Arab Emirates
 | +6,700 | +6,700 |
 United States of America
 | +3,800 | +3,800 |
 Singapore
 | +3,500 | +3,500 |
 Canada
 | +3,200 | +3,200 |
 Australia
 | +2,500 | +2,500 |
 Italy
Italy | +2,200 | +2,200 |
 Switzerland
 | +1,500 | +1,500 |
 Greece
 | +1,200 | +1,200 |
 Portugal
 | +800 | +800 |
 Japan
Japan | +400 | +400 |
The UAE is the top place for millionaires moving in 2024. It has no income tax, offers golden visas, a luxurious lifestyle, and a great location. It’s expected to attract almost twice as many millionaires as the US, which is the next popular choice with 3,800 millionaires moving there.
Singapore maintains its 3rd position this year with a net inflow of 3,500 millionaires, while Canada and Australia continue as popular choices, ranking 4th and 5th with net inflows of 3,200 and 2,500 millionaires respectively. In Europe, Italy (+2,200), Switzerland (+1,500), Greece (+1,200), and Portugal (+800) also secure spots in the Top 10 for net millionaire inflows in 2024. Additionally, Japan is set to welcome 400 wealthy migrants, driven partly by a growing trend of Chinese high-net-worth individuals relocating to Tokyo following the Covid-19 pandemic.
In Europe, Italy (+2,200), Switzerland (+1,500), Greece (+1,200), and Portugal (+800) are notable destinations among the top 10 for net millionaire inflows. Japan is also set to welcome +400 wealthy migrants, fueled in part by an increasing trend of Chinese high-net-worth individuals relocating to Tokyo post-Covid-19. These trends underscore a dynamic global landscape where tax incentives, quality of life, and strategic locations play pivotal roles in millionaire migration patterns.
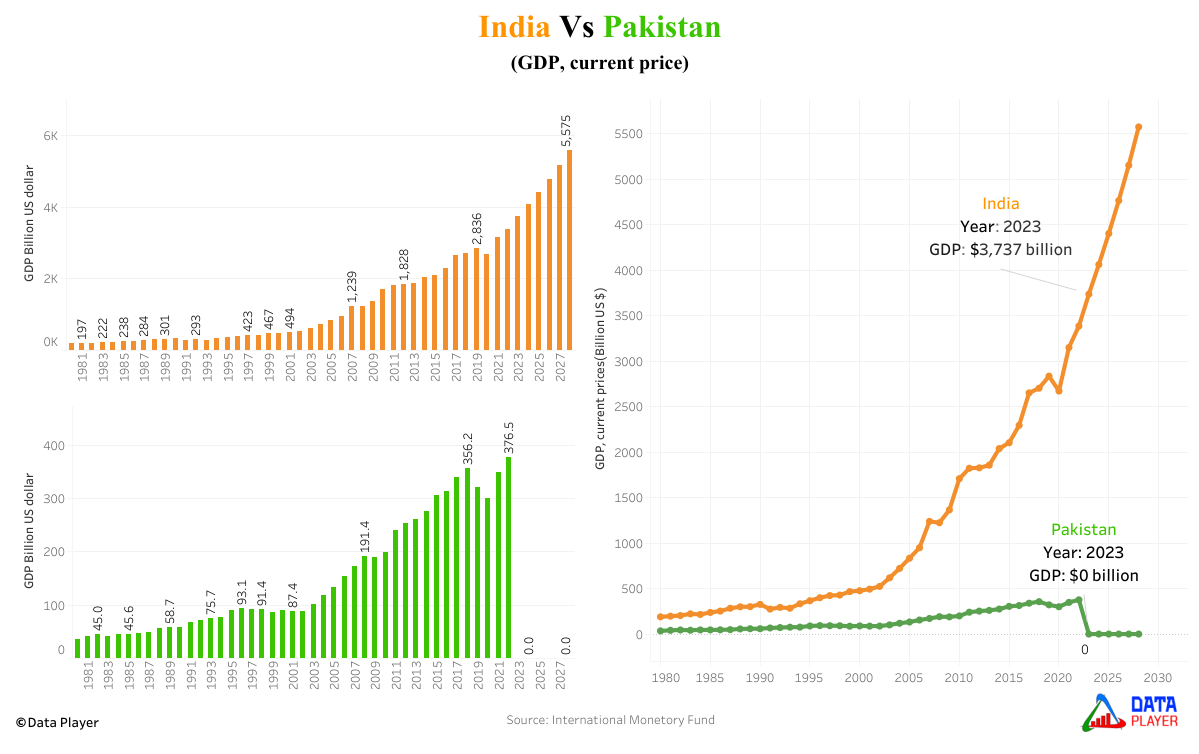
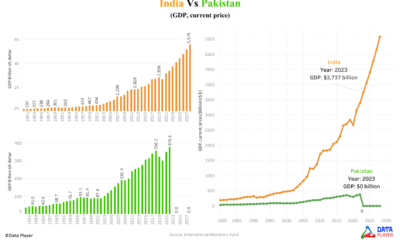
The 2023 biggest Crisis of the economy in South Asia is going on in Pakistan that has never seen such a disaster since it became apart from India(Hindustan) in august 1947 and drew a thick political border. Several challenges have occurred for the Pakistani residents in order to survive as basic food(Ata flour, rice, and vegetables), oil and gas prices are touching the sky. However, it has been perceived that those basic nourishment have 3 times lower cost in India and are affordable to Indian people. GDP nominal of India is 3700 billion dollar in 2023 while Pakistan represents almost zero billion dollar in its GDP. Moreover, liabilities and external debt that Pakistan holds as of december 2022 is $126 billion.
Impact of trade relation between India and Pakistan on Pakistan’s economy
The geographical link between India and Pakistan is the only Wagah border which lies on a grand trunk road and connects from Amritsar to Lahore. Punjab, Rajasthan, Gujarat and Jammu & Kashmir are the four states of India which share their boundary with Punjab(Pakistan), Sind(Pakistan) and POJK(Pakistan occupied Jammu Kashmir).
Over the past 75 years, these two nations which are also known as nuclear power countries have fought war about three times 1947, 1965 and 1999 only for the territory of Kashmir. And this is the primary cause of the worst trade relation between both the countries. Till 1956, India was Pakistan’s largest trading partner but just after that it started fluctuating and the war happened in 1971 which created Bangladesh as a separate state from Pakistan. The trade has completely halted between both the nations after the reorganisation act 2019 of Jammu & Kashmir. In 2018, GDP(nominal) of Pakistan was 356 billion US dollar while it dropped to 321 billion US dollar in 2019 and kept down till 300 billion US dollar in 2020. However, the economy of Pakistan became almost zero in 2023. Pakistan is still doing trade with India but through third countries especially via the United Arab Emirates which led to a hike in every product’s prices in Pakistan. For instance, if tomatoes are 20 rupees per kg in India, suppose after tax the price becomes 40 rupees per kg in UAE. Now when Pakistan is buying tomatoes from the UAE it will cost 60 rupees per kg after tax.
| Year | India (billions) | Pakistan (billions) | Difference (billions) |
|---|---|---|---|
| 1980 | $189 | $35 | $155 |
| 1981 | $197 | $41 | $155 |
| 1982 | $204 | $45 | $159 |
| 1983 | $222 | $42 | $180 |
| 1984 | $216 | $46 | $170 |
| 1985 | $238 | $46 | $192 |
| 1986 | $253 | $47 | $206 |
| 1987 | $284 | $49 | $235 |
| 1988 | $300 | $56 | $243 |
| 1989 | $301 | $59 | $243 |
| 1990 | $327 | $59 | $268 |
| 1991 | $275 | $67 | $208 |
| 1992 | $293 | $72 | $222 |
| 1993 | $284 | $76 | $208 |
| 1994 | $333 | $76 | $257 |
| 1995 | $367 | $89 | $277 |
| 1996 | $400 | $93 | $307 |
| 1997 | $423 | $92 | $331 |
| 1998 | $429 | $91 | $337 |
| 1999 | $467 | $87 | $380 |
| 2000 | $477 | $90 | $387 |
| 2001 | $494 | $87 | $407 |
| 2002 | $524 | $88 | $436 |
| 2003 | $618 | $101 | $517 |
| 2004 | $722 | $119 | $603 |
| 2005 | $834 | $133 | $701 |
| 2006 | $949 | $154 | $795 |
| 2007 | $1,239 | $172 | $1,067 |
| 2008 | $1,224 | $191 | $1,033 |
| 2009 | $1,365 | $189 | $1,176 |
| 2010 | $1,708 | $199 | $1,509 |
| 2011 | $1,823 | $240 | $1,583 |
| 2012 | $1,828 | $253 | $1,575 |
| 2013 | $1,857 | $260 | $1,596 |
| 2014 | $2,039 | $275 | $1,764 |
| 2015 | $2,104 | $304 | $1,799 |
| 2016 | $2,295 | $314 | $1,981 |
| 2017 | $2,651 | $339 | $2,312 |
| 2018 | $2,703 | $356 | $2,347 |
| 2019 | $2,836 | $321 | $2,515 |
| 2020 | $2,672 | $300 | $2,371 |
| 2021 | $3,150 | $348 | $2,802 |
| 2022 | $3,386 | $376 | $3,010 |
| 2023 | $3,737 | $0 | $3,737 |
| 2024 | $4,062 | $0 | $4,062 |
| 2025 | $4,403 | $0 | $4,403 |
| 2026 | $4,766 | $0 | $4,766 |
| 2027 | $5,153 | $0 | $5,153 |
| 2028 | $5,575 | $0 | $5,575 |
Conclusion
Pakistan’s economy started dying at the end of 2022 and the crisis has completely gripped all over the land. People of Pakistan are facing extreme poverty these days because prices of every goods have kept increasing. The value of Pakistani rupees has become valueless where rate of $1 = 300 PKR however rate of $1 is just 82 Indian rupee(INR). There is no comparison of economy between India and Pakistan even though both nations started growing since 1947. India has achieved $3,737 billion in its economy and is predicted to become $5,575 billion in 2028 while no prediction can be made about Pakistan’s economy. Inflation rate in Pakistan has hit 38% as of May 2023 and made the highest record in South Asia.
Where does the Data fetch from?
Data Source: Data for GDP are fetched from International Monetary Fund(IMF)” from the year 1980 to 2028(future). Several information are taken from Wikipedia, USIP, Le Monde, High commission of India, The print and Live mint.

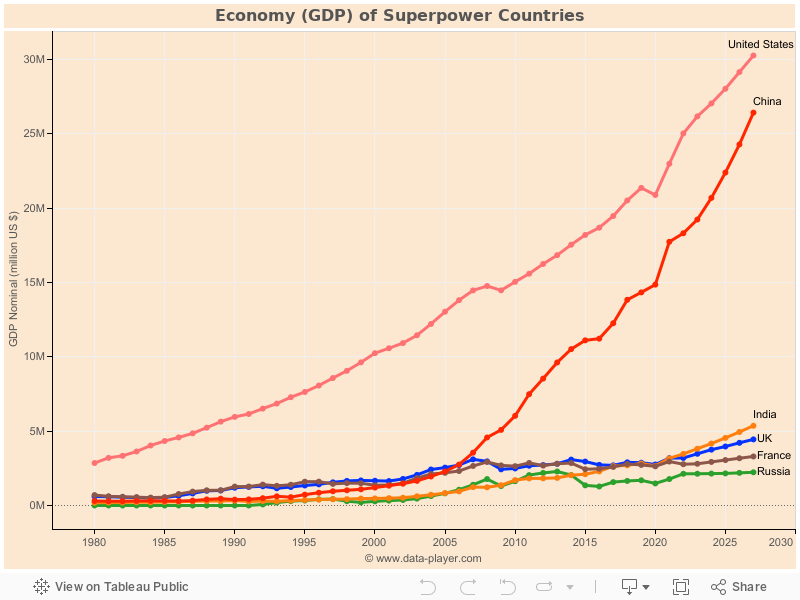
In the past few decades, India has made significant progress in terms of economic growth, technological development, and geopolitical influence therefore it shows the potential to become a superpower country. India has already overtaken the United Kingdom (one of the Superpower countries) and becomes the fifth-largest economy in the world.
The visualization charts below give a clear understanding of GDP to the people and oppress them to think at different points in the graph.
Existing Superpower Countries
There are 5 superpower countries also referred to as VETO power and these countries include the United States, China, Russia, the United Kingdom and France. Eight main factors that made these country a Superpower. Those factors are demography, geography, economy, politics, foreign relations, military media and culture. The above five countries have rich mentioned factors therefore they are known as superpower countries. These countries have the tendency to help and support other countries by providing them funds to satisfy their necessities. The economy plays a vital role in a superpower country.
A Brief History of Indian Economy
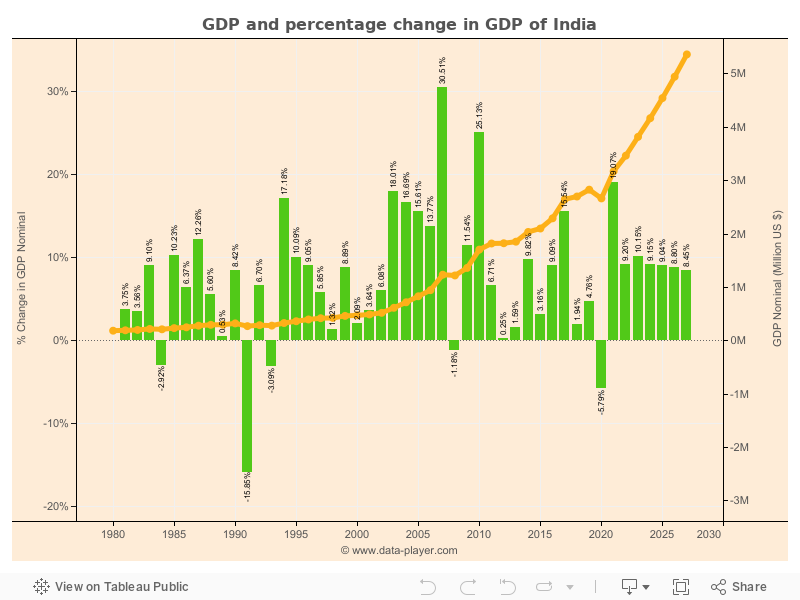
After getting independence in 1947 from Britain, India kept growing its economy slowly from 1980 to 1993 but suddenly a hike took place and the economy graph started progressing linearly (same as the graph of equation, y = x) from 2002 to 2011. The graph and data table of Indian nominal GDP can be seen in the following. The massive change in the Indian economy was a glimpse of 2007 when the change in the percentage of GDP from 2006(949,117 million US $) to 2007(1,238,700 million US $) appeared as 30.51%. However, there were a few downfalls in the nominal GDP. In 2020, huge destruction has been noticed in the Indian economy because of the national and international lockdown and it affected percentage change in nominal GDP to -5.79%. It was the biggest downfall since 1991 however the percentage change in nominal GDP was -15.85% in 1991.
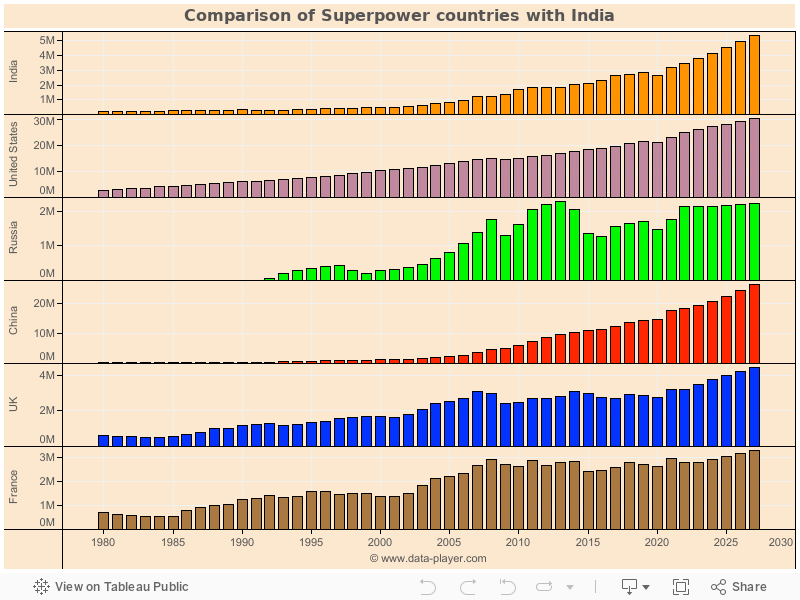
Comparison of Existing Superpower(VETO) Countries with India
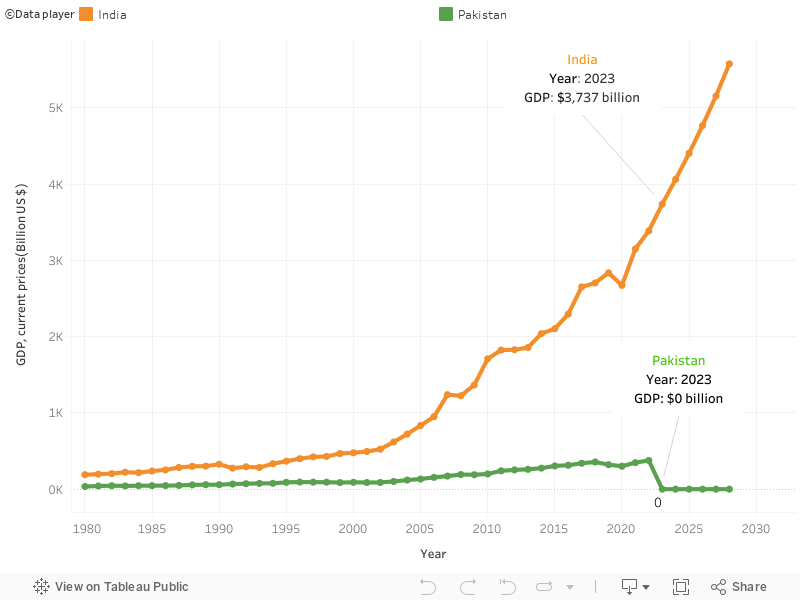
According to the line graph, The United States has always been high in terms of nominal GDP since 1980 But that will not always be true as China is predicted to overcome in the coming decades followed by India. India had been last ranked among the superpower countries from 1980 till 1996 but Now in 2023 India (with a 10.3% percentage change in GDP) has jumped over the UK and secured 3rd place within superpower countries, therefore, India is considered as the fastest growing economy in the world.
Conclusion
Economy has always been important for the Indian government and it is clearly seen from the above visualization charts how its GDP(nominal) has grown from 1980 to 2023 and predicted from 2024 to 2027. India has almost all the potential to join the permanent member of VETO power in the next few years as India has gained the superpower economy, good foreign relationship, military power, rich culture and demographics. According to the International Monetary Fund(IMF) and above charts, India has surpassed the United Kingdom in terms of GDP(nominal) in 2022 and occupied third place in the world. Now, the next target is to leave China and the United States behind even though they are far from reach. However, there are still many challenges that India faces in its journey towards becoming superpower country, such as improving infrastructures, reducing poverty, and inequality, and addressing political and social issues. It is important to note that becoming a superpower is not just about economy and military might, but also about promoting human rights, democracy, and stability.
Where does GDP Nominal Data fetch from?
Data Source: Data for GDP Nominal of Superpower Countries are fetched from International Monetary Fund(IMF)” from the year 1980 to 2027(future).
Data Info: All the data mentioned in the table and charts are measured in millions except percentage change. Percentage change in GDP column is calculated using formulae ((y-x)/y)*100.
Tools: Software that are used primarily for vizualizations (such as bar and line chart) are Tableau and Excel. Table is re-structured with the use of python libraries eg. pandas and numpy.

 Economy2 years ago
Why Pakistan’s economy is drowning while India’s economy is touching the sky
- Religion7 months ago
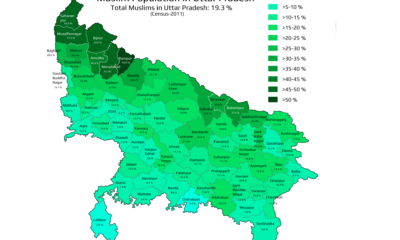
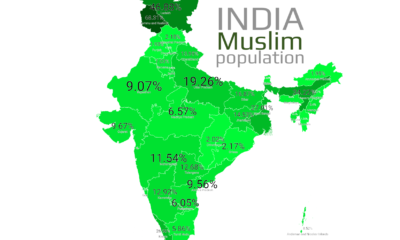
Mapped: What are the muslims population in Uttar Pradesh | State of India
- Technology1 year ago
Highest number of software developers by country in the world 2023 by GitHub | Data Player
- Demographics7 months ago
Mapped: Average Working Hours by European Countries in 2024
- Superpower countries7 months ago
Global Nuclear Warhead Distribution by Nation 2024
- Demographics2 years ago
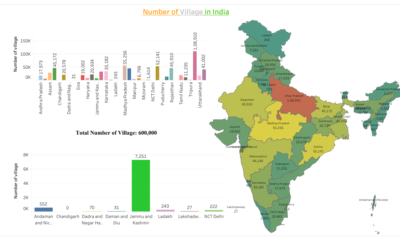
What are the Number of Villages in India by its State and Union Territory
- Demographics2 years ago
Massive population size by Indian states 2023
- Demographics2 years ago
Ranked: Highest Populated Countries (2023)