Population
The Rise of Asian Ethnic groups in 21st Century in the United Kingdom
Published
6 months agoon

The United Kingdom is known for its diverse population, comprising ethnic groups from all over the globe. This cultural landscape includes a mix of different traditions, colors (white, semi-black, black), and languages. The diversity in the UK began as early as the 11th century when King William the Conqueror brought the first white Jewish settlers to England. Fast forward to the 16th century, and the Romanians began to arrive. By 1730, the African slave trade brought black people to the UK. Following World War II, Britain faced a significant labor shortage, which led to an influx of immigrants from the Indian subcontinent including countries like India, Pakistan, Bangladesh, Bhutan, Maldives, Nepal, and Sri Lanka between 1948 and 1950.
This movement of people enriched the cultural landscape of the UK and introduced a variety of new traditions, cuisines, and languages. This article explores how Asian ethnic groups, especially those from India, Pakistan, Bangladesh, and China, have continued to grow and contribute to the UK’s diversity in the 21st century. These communities have established vibrant neighborhoods, cultural festivals, and businesses, further enhancing the multicultural fabric of the UK. The ongoing growth of these ethnic groups reflects the UK’s continuing appeal as a destination for people seeking new opportunities and a better quality of life.
How many Asians in the United Kingdom?
The United Kingdom, geographically composed of four countries—England, Scotland, Wales, and Northern Ireland—has seen a significant growth in its Asian population across all regions. In recent years, Asian ethnic communities have become a prominent presence throughout the UK, reflecting broader trends of diversity and demographic change. According to 2021 data, the Asian population in the United Kingdom reached 5.8 million, a substantial increase from 1.8 million in 1991. This growth, more than tripling over three decades, highlights the evolving multicultural landscape within the nation.
Census 1991: Distribution of Asian Ethnic Populations Across UK Regions
According to the 1991 Census, the distribution of the Asian ethnic population across the United Kingdom was notably concentrated in England, with a total of 1.76 million individuals. This represented approximately 96% of the UK’s Asian ethnic population, highlighting England as the primary region for Asian communities at that time. Wales had a relatively small population of 24,300 Asian residents, while Scotland counted 47,400. Interestingly, Northern Ireland reported no Asian ethnic population, indicating a distinct lack of migration to that area compared to other regions. The data underscores a clear preference among Asian communities for settling in England, with significantly fewer moving to Wales or Scotland and no movement recorded towards Northern Ireland.
Asian Population Concentration in England’s Sub-Regions
There are several sub-regions in England such as Greater London, East and West Midlands, etc. In 1991, England’s Asian population was most densely concentrated in Greater London. Asians made up 10.33% of Greater London’s total population, amounting to approximately 690,000 individuals. In contrast, other sub-regions across England, including areas like the East and West Midlands, reported Asian populations below 10% relative to their respective populations. This data suggests that Greater London was the most appealing destination for Asian communities within England, standing out as the region with the highest concentration of Asian residents.
Census 2001, 2011, 2021
The Asian population in the UK has steadily grown over the past two decades. In 2001, Asians made up 2.6 million people, or 4.39% of the UK’s population. By 2011, this increased to 4.4 million (6.92%), and in 2021, it reached 5.8 million (8.6%). This shows that from 2001 to 2021, the Asian population more than doubled.
A similar trend is seen in England. In 2001, Asians made up 4.58% of England’s population. This rose to 7.82% in 2011 and then to 9.61% in 2021. The largest growth occurred between 2001 and 2011, with a 3.24% increase, while growth slowed to 1.79% between 2011 and 2021. This suggests that more Asian immigrants arrived in England between 2001 and 2011 compared to the following decade.
In Scotland, the Asian population has been steadily growing, reaching 212,022 people, or 3.9% of the population, in 2021. From 2001 to 2011, the Asian population grew by 1.25%, followed by another increase of 1.24% from 2011 to 2021. This consistent growth shows that Asians have been gradually moving to Scotland since 2001.
In Wales, Asians make up a small percentage of the population at 2.86%, totaling 89,028 people in 2021. The Asian population increased by 45,000 from 2001 to 2011, but growth slowed, with only an additional 19,000 from 2011 to 2021.
In Northern Ireland, the Asian population was just 6,000 in 2001 but grew to 30,000 in 2021, representing 1.61% of the population.
Urban Growth and Regional Population Shifts in 21st Century England
Greater London shows a significant increase from 866,693 in 2001 to 1,817,640 in 2021, with a proportional rise from 12.08% to 20.66% of the total. This growth is the most substantial among the regions, reflecting urbanization and migration trends. The West Midlands and North West follow, each showing notable increases, with the West Midlands rising from 7.32% to 13.35%. Other regions, such as the South East and Yorkshire and the Humber, also experienced growth but at a more moderate rate. Overall, urban areas like Greater London and the West Midlands experienced the most considerable growth, while rural or smaller urban areas saw slower, though steady, increases over these two decades.
Distribution of Asian ethnic groups in the UK
The majority of Asians in the United Kingdom are from India, Pakistan, Bangladesh, and China. The Indian population has grown steadily, making up 2% of the UK population in 2001, 2.5% in 2011, and 3.1% in 2021—a consistent increase of 0.5% each decade. Similarly, the Bangladeshi ethnic group has grown by 0.3% from 2001 to 2011 and again from 2011 to 2021. This steady growth shows that the Indian and Bangladeshi populations in the UK are consistently rising over time.
Pakistanis are the fastest-growing Asian ethnic group in the UK, with a 0.6% increase from 2001 to 2011 and a further 0.7% from 2011 to 2021. In contrast, the Chinese ethnic group has shown slower growth, increasing by 0.3% from 2001 to 2011 and then remaining steady at 0.7% from 2011 to 2021.
Overall, Pakistanis are the fastest-growing Asian group, while the Chinese group has the slowest growth rate in the UK.
Future of Asian Ethnic group in the United Kingdom
As of 2021, Asian ethnic groups make up 9.3% of the UK’s population, totaling 5.8 million people. With steady growth, it is projected that Asians could make up over 50% of the UK’s population by the year 2191. Currently, Indians are the largest Asian group at 3.1% of the population, followed by Pakistanis at 2.7%. Given that Pakistanis are growing faster than other Asian groups, their population is expected to reach 3.33% by 2031, matching the projected Indian population. By 2081, Pakistanis may surpass Indians, making up 6.58% of the UK population compared to 6.38% for Indians. The reason could be high immigration and fertility rate.
Over the next century after 2081, Asian populations are estimated to reach 48.71% of the UK population, with Pakistanis at 13.08%, Indians at 11.88%, Bangladeshis at 5.9%, and Chinese at 3.15%. Using current data it is expected that growth rates for Asian groups slows down after the year 2181. Below given data table is in percentage.
List of Asian Ethnicity in the UK 2021

You may like


Who is running in the 2024 U.S. presidential election?


Global Nuclear Warhead Distribution by Nation 2024


Mapped: What is Muslim Population in India by its State | Census 2011


Mapped: Average Working Hours by European Countries in 2024
Religious Demographics of London by Area | Constituency 2021


Muslim Population in London 2021 by Constituency: A Visual Guide
Population
Find Out Which UK City in the North West Has Over 40% Muslims
Published
11 hours agoon
April 24, 2025
When it comes to diversity, the United Kingdom stands out, with a growing Muslim population due to immigration and a higher birth rate. Islam has become the second-largest religion in the UK after Christianity. In some cities in the North West region, the Muslim population has exceeded 40% according to census 2021. The British constitution ensures the freedom for Muslims to live and practice their religion, as long as it does not promote hate or incite terrorism. Muslims are able to celebrate all their religious festivals freely.
The northwest region of England has 75 constituencies where Muslims are present, according to recent data. From 2011 to 2021, the Muslim population increased in every constituency, although the growth varied. In some areas, the increase was significant, while in others, it was more modest.
One notable example is Blackburn, which experienced a substantial rise in its Muslim population. By 2021, Muslims made up approximately 45.99% (~46%) of Blackburn’s population, compared to 36.25% in 2011.
Blackburn is now the city with the highest Muslim population in the northwest region of England. In the county of Lancashire, Blackburn, Pendle and Preston are the only three cities that rank among the top ten for Muslim population. In 2021, Blackburn has a Muslim population of 46%, while Pendle and Preston stands at 26% and 19.37% respectively. The Muslim population in Blackburn has experienced a significant increase of 35.3% over the past 10 years(from 2011 to 2021). This means that for every 100 Muslims in Blackburn a decade ago, there are now approximately 35 more, reflecting notable growth in the community.
Religious Data Table of Blackburn
However, Manchester-Gorton has the second-highest Muslim population among constituencies, with Muslims making up approximately 39% (38.96%) of its total population. In numbers, this equals around 46,841 people (46k).
The table below lists all the constituencies in North-West Region along with their Muslim population and corresponding percentages for the years 2011 and 2021.
Data table of muslim population in the North-West of England
Demographics
Religious Demographics of London by Area | Constituency 2021
Published
10 months agoon
July 8, 2024| Constituency | Data |
|---|
Copyright: © 2024 Data Player
*Note Hover or click on constituency name to get full view, A tooltip box will appear little bit down.
Data source: ONS Religion 2021 Census, House of Commons Library
This bar chart shows the population of different religions in London.
The following tools and technologies were used:
- HTML and CSS for the webpage structure and styling
- JavaScript for fetching and processing data
Population
Muslim Population in London 2021 by Constituency: A Visual Guide
Published
10 months agoon
July 3, 2024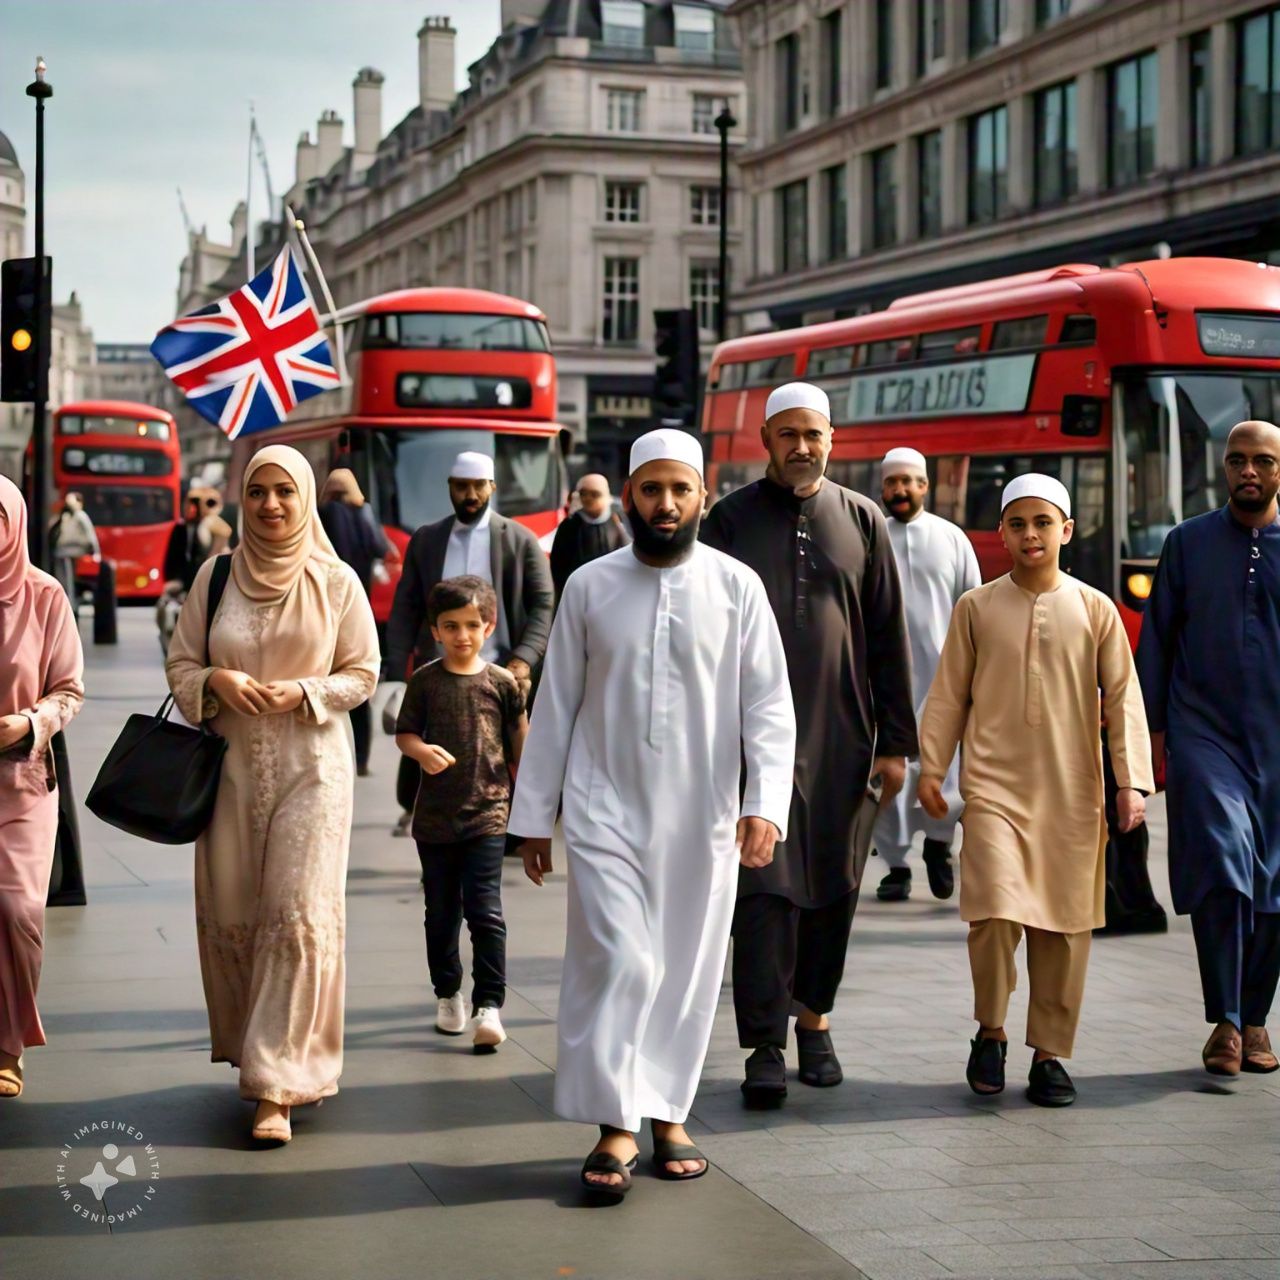
| Constituency | Muslim Population |
|---|
Copyright: © 2024 Data Player
Data source: ONS Religion 2021 Census, House of Commons Library
This bar chart shows the Muslim population in London by its constituency both in numerically and percentage-wise.
The following tools and technologies were used:
- HTML and CSS for the webpage structure and styling
- JavaScript for fetching and processing data
Trending

 Economy2 years ago
Why Pakistan’s economy is drowning while India’s economy is touching the sky

 Technology1 year ago
Highest number of software developers by country in the world 2023 by GitHub | Data Player

 Religion9 months ago
Mapped: What are the muslims population in Uttar Pradesh | State of India

 Demographics10 months ago
Mapped: Average Working Hours by European Countries in 2024

 Demographics2 years ago
What are the Number of Villages in India by its State and Union Territory

 Superpower countries9 months ago
Global Nuclear Warhead Distribution by Nation 2024

 Demographics2 years ago
Massive population size by Indian states 2023

 Religion1 year ago
World’s Largest Religion in 2024 | Data Player


