Religion
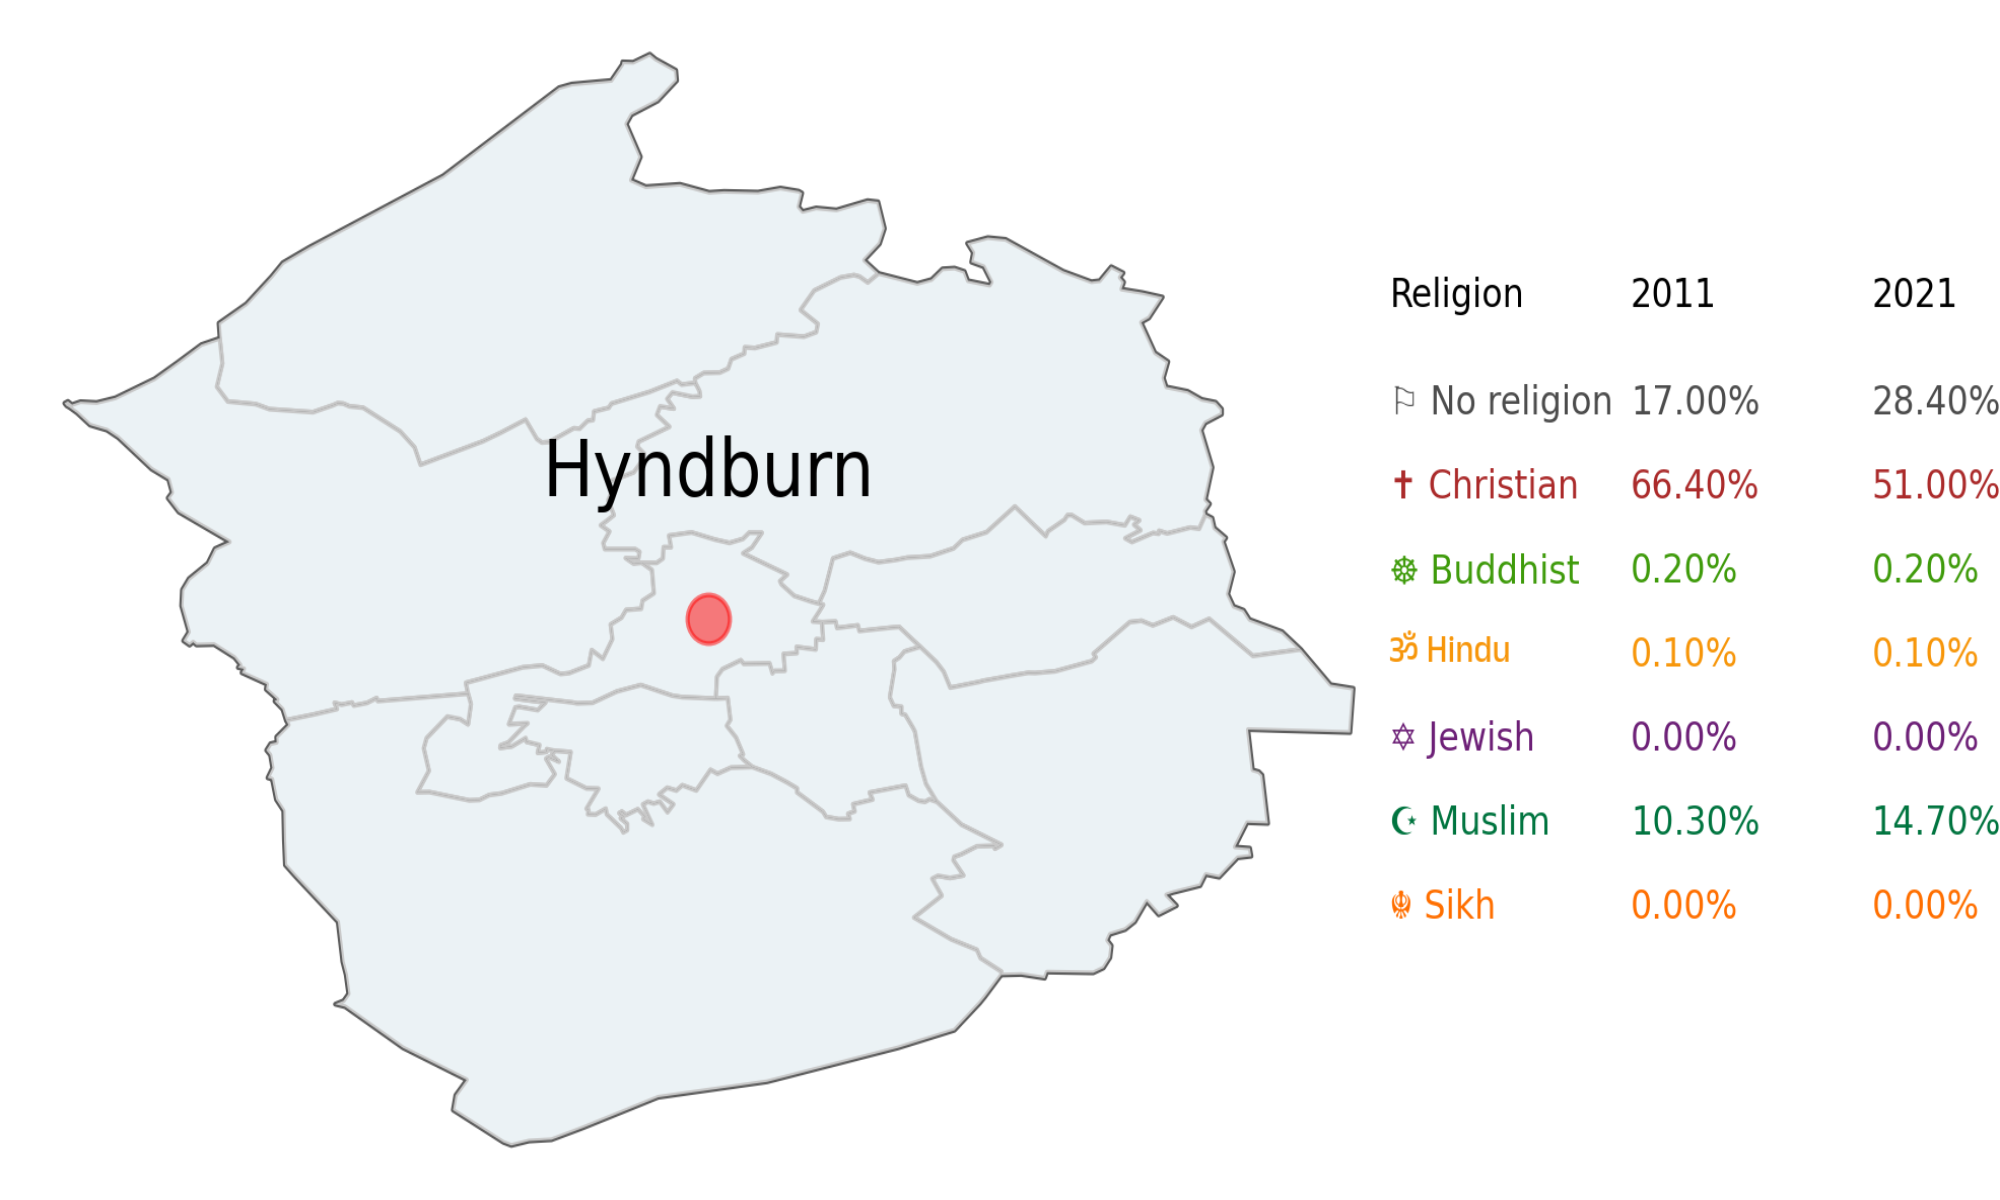
Religious Demographics of Hyndburn, Lancashire, England, United Kingdom
Published
2 years agoon
Hyndburn is a place in Lancashire, England. It has been growing and getting more diverse. In 2011, about 80,734 people lived here. By 2021, it increased to around 81,754, with about 1,020 new people moving in over ten years. In Hyndburn, there are people from different religions like Christianity, Buddhism, Hinduism, Islam, Sikhism, and others. This means there are lots of different beliefs here. People from many backgrounds and cultures live together in Hyndburn. Everyone brings something special to the town, making it a great place to live for people of all religions.
List of Religion in Hyndburn
The data for Hyndburn demonstrates significant changes in population and religious demographics from 2011 to 2021. There has been a notable increase in the number of residents living in Hyndburn, indicating growth and shifts in its population dynamics. Additionally, there's been an evident diversification in religious beliefs among the residents.
- No Religion: 🙏
- In 2011, approximately 17% of the population in Hyndburn identified as having no religious affiliation. But guess what? By 2021, that number has soared to 28.4%! It’s like the “No Religion” category decided to throw a massive party, and everyone’s invited!
- Maybe they’ve got a secret handshake or a “No Religion” club where they discuss the mysteries of the universe over coffee. Who knows? 🤷♂️
- Christianity: ⛪
- Back in 2011, 66.4% of Hyndburn’s residents were proudly waving the Christian flag. But hold your hymnals! By 2021, that percentage dropped to 51%. It’s like the angels had a meeting and decided to diversify their portfolio.
- Maybe they’re experimenting with new hymns or organizing bake-offs to keep things interesting. “Holy cupcakes, Batman!” 🧁
- Buddhism: ☸️
- The Buddhists in Hyndburn are a small but zen-tastic group. In both 2011 and 2021, they held steady at 0.2% of the population. Maybe they’re all meditating together, achieving enlightenment, and sharing memes about inner peace. 🧘♀️
- Hinduism: 🕉️
- The Hindu community in Hyndburn is like a cozy little temple. They started at 0.1% in 2011 and gracefully glided to 0.1% in 2021. Maybe they’re hosting epic Diwali parties or practicing their dance moves for the next Holi festival. 🎉
- Judaism: 🕍
- The Jewish population in Hyndburn is small but mighty. From 7 in 2011, they multiplied like matzah during Passover to reach 28 in 2021. Perhaps they’re hosting bagel brunches or debating the best way to pronounce “challah.” 🥯
- Islam: ☪️
- The Muslim community in Hyndburn is growing! In 2011, they accounted for 10.3% of the population, and by 2021, they’ve expanded to 14.7%. Maybe they’re organizing interfaith dialogues or hosting epic Eid feasts. 🕌
- Sikhism: 🪶
- Sikhs in Hyndburn are like the turban-wearing superheroes of the community. They started at 0.0% in 2011 and maintained their cool factor at 0.0% in 2021. Maybe they’re busy perfecting their Bhangra moves or discussing the best way to tie a dastaar. 💪
- Other Religions: 🌟
- The “Other Religion” category is like a mysterious treasure chest. They went from 0.3% in 2011 to 0.4% in 2021. Maybe they’re practicing ancient rituals or deciphering cryptic scrolls. 🔮
- Not Stated: 🤔
- Ah, the enigmatic “Not Stated” group. In 2011, they were at 5.7%, and by 2021, they’ve subtly shifted to 5.2%. Maybe they’re playing hide-and-seek with the census takers or writing their memoirs under pen names. 📚
So there you have it! Hyndburn’s religious landscape is a colorful mosaic of beliefs, traditions, and spiritual journeys. Whether you’re praying, meditating, or just enjoying a good cup of chai, this town has a little something for everyone. 🌈✨
The religious landscape of Hyndburn has undergone a remarkable transformation over the past decade. The proportion of residents identifying as non-religious surged from 15.6% in 2011 to 25.3% in 2021, a significant leap of 9.7 percentage points. This shift, one of the most pronounced among all major religious groups in the town, underscores a profound change in the spiritual fabric of Hyndburn, with an increasing number of its inhabitants embracing a life without religious affiliation.
The shift in religious identification in Hyndburn from 2011 to 2021 is quite intriguing. The significant 9.7 percentage point increase in residents identifying as “No religion” suggests a broader societal trend towards secularism. This could be influenced by various factors such as increased access to diverse viewpoints, changes in societal norms, or evolving personal beliefs. It’s also noteworthy that this change is one of the most substantial among all major religious groups in Hyndburn, indicating a profound evolution in the town’s spiritual dynamics. This trend could have far-reaching implications for community life, policy-making, and social cohesion in Hyndburn.
Year 2011
Year 2021
In Hyndburn, the Christian population has also seen a decline from 53,602 (66.4%) in 2011 to 41,949 (51.0%) in 2021. Despite this decrease, Christianity continues to hold a significant presence within the town, reflecting broader national patterns of evolving religious beliefs and behaviors. Christian churches and institutions remain important contributors to Hyndburn's social landscape, actively engaging in community events and charitable initiatives, which play a vital role in fostering a sense of togetherness and communal spirit among residents.
Conclusion: Hyndburn, with its diverse spiritual tapestry, is a town where belief systems intertwine like threads in a cosmic quilt. From the soaring ranks of the “No Religion” crew to the steadfast Buddhists maintaining their zen, each group contributes to the vibrant mosaic of faith. The angels might be revising their hymnals, the Hindus celebrating Diwali, and the Jews sharing bagels, but together, they form a harmonious symphony of humanity. So whether you’re meditating, praying, or simply pondering the mysteries of existence, Hyndburn invites you to join its cosmic conversation. 🌟🙏✨

You may like


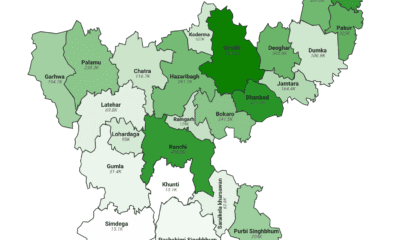
Muslim Population in Jharkhand (2025 Update): District-Wise Data, Percentage & Analysis
-
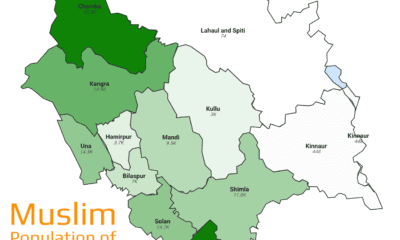
What is muslim population of Himachal Pradesh, India by its district?
-
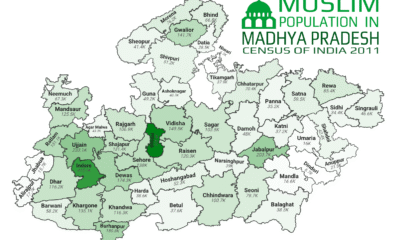
What is muslim population of Madhya Pradesh, India by its district?
-
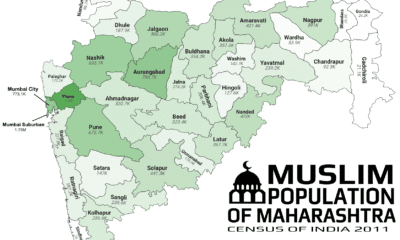
What is Muslim population of Maharashtra, India by its district?
-
Knife Crime in England and Wales: A Deepening Danger We Can’t Ignore
-
What is muslim population of Tamil Nadu, India by its district?


Religion
Muslim Population in Goa (2025 Update): District-Wise Data, Percentage & Analysis
Published
11 months agoon
August 10, 2025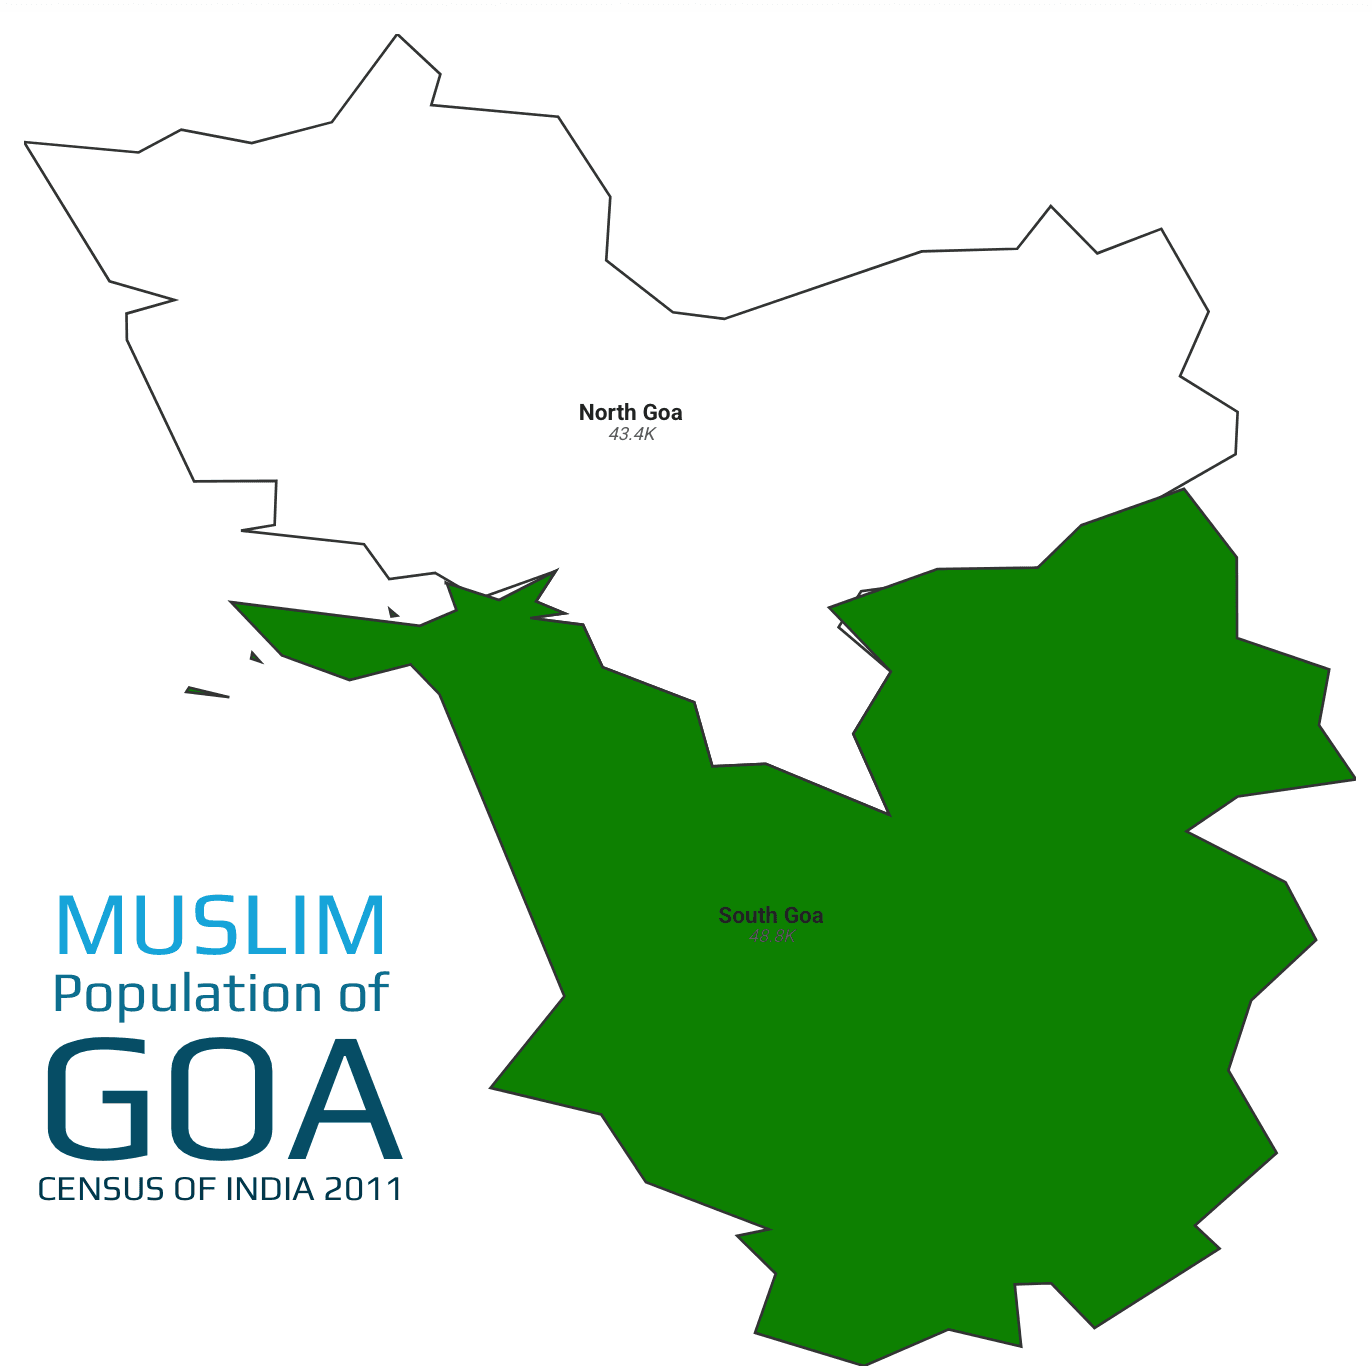
Excerpt: Goa, India’s western coastal gem, is renowned for its beaches, spice plantations, and vibrant tourism-driven economy. Though predominantly Hindu, the state is home to a small but dynamic Muslim community, whose traditions, livelihoods, and social engagement enrich Goa’s multicultural fabric.
According to the 2011 Census, Goa comprises two districts—South Goa and North Goa—with a combined population of 1,347,668, of which 92,210 are Muslims, forming 6.84% of the total[1]. South Goa records the higher share, at 8.3%, while North Goa stands at 5.7%.
Konkani and Marathi are widely spoken across Goa, while Urdu and Arabic script feature in mosque inscriptions and community literature. Goa’s Muslim residents participate actively in tourism, fishing, horticulture, and small-scale trade, with urban pockets showing growing involvement in hospitality and services.
Muslim Population in Goa’s Districts (2011 Census)
South Goa leads with 8.3%, reflecting its historical Arab trade links and plantation communities, while North Goa’s 5.7% presence is rooted in fishing villages and market towns.
Total Muslim vs Non-Muslim Population in Goa (2011 Census)
Muslims account for 6.84% of Goa’s population, with non-Muslims forming the remaining 93.16%. The community contributes to Goa’s service-oriented economy through hospitality, artisanal crafts, and coastal trade.
South Goa: South Goa, with 589,095 residents, includes 48,827 Muslims (8.3%). The coastal district’s economy thrives on tourism, fishing, and spice cultivation; within this, Muslim families run guesthouses, operate backwater cruises, and manage cashew and coconut farms. Community life centers around historic mosques in Margão and Vasco da Gama, with annual festivals like Eid and Milad-un-Nabi drawing both locals and visitors into vibrant cultural fairs, underscoring their integral role in South Goa’s social tapestry.
North Goa: North Goa, home to 758,573 people, counts 43,383 Muslims (5.7%). Renowned for its beaches and heritage towns like Panaji and Mapusa, the district sees Muslim engagement in fishing cooperatives, beachside shacks, and textile vending at local markets. Their social infrastructure includes small madrasas and jaals (community circles), which support religious education and charitable activities. The community balances tradition with tourism-driven enterprise, enriching North Goa’s pluralistic identity.
Muslim Population by District in Goa (2011 Census)
References
- Census of India. C-01: Population by religious community, Goa – 2011. Available at: https://censusindia.gov.in/nada/index.php/catalog/study/PC11_C01-30
Religion
Muslim Population in Telangana (2025 Update): District-Wise Data, Percentage & Analysis
Published
11 months agoon
August 9, 2025Excerpt: Telangana, India’s youngest state formed in 2014, blends rich Nizam heritage, burgeoning IT hubs, and vast rural landscapes. While Hindus form the majority, a substantial Muslim community—rooted in Hyderabad’s historic Old City and spread across urban and rural districts—contributes through trade, culture, and public service, enriching Telangana’s plural fabric.
According to the 2011 Census, Telangana’s total population is approximately 35.19 million, of which about 3.84 million are Muslims, constituting 10.91% of the state’s population[2][3]. The Muslim population is concentrated in Hyderabad, Nizamabad, and other northern and central districts.
Telugu is the dominant language, with Urdu prominent among Muslim communities, especially in Hyderabad and Nizamabad. Urban districts show higher Muslim participation in IT, education, and services, while rural districts engage in agriculture, small trade, and local crafts.
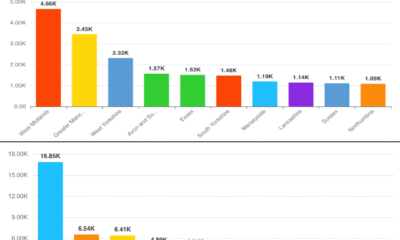
Top 10 Districts by Muslim Population in Telangana
Hyderabad (43.45%) leads with the highest Muslim proportion, reflecting its historic Deccan sultanate legacy. Northern districts like Nizamabad (18.52%), Sangareddy (16.15%), and Nirmal (14.04%) also exhibit significant Muslim shares, influenced by medieval trade routes and Nizam administration.
Districts like Jayashankar Bhupalpally (2.95%) and Jangaon (3.19%) have the lowest Muslim shares, reflecting limited historical settlement. Central districts such as Peddapalli (6.03%) and Khammam (6.05%) also show lower proportions due to agrarian economies and fewer urban centers.
Total Muslim vs Non-Muslim Population in Telangana (2011 Census)
Muslims constitute 10.91% of Telangana’s population, while non-Muslims form 89.09%, highlighting a distinct minority concentrated in urban and selected rural districts.
Muslim vs Hindu Population in Telangana (2001 & 2011 Census)
Between 2001 and 2011, Telangana’s Muslim population rose nearly 20%, outpacing Hindu growth of 9.4%, driven by urban migration into Hyderabad and natural growth in northern districts[4]
Districts with Highest Muslim Density per 100,000 People in Telangana
Hyderabad and Sangareddy display the highest Muslim densities, reflecting dense urban settlements and peri-urban expansion influenced by the IT corridor and historic city growth.
Small Population Districts with Low Muslim Percentage
Mulugu, Jayashankar Bhupalpally, and Jangaon are smaller districts with under 4% Muslim presence, shaped by tribal demographics and minimal historic influx.
Adilabad (12.58%): Adilabad, population 708,972, has 89,208 Muslims. Bordering Maharashtra, its tribal and forestry economy contrasts with Muslim engagement in small‐scale trade, transportation, and leather crafts. Hyderabad State-era administrative centers left Urdu‐speaking enclaves. Weekly markets in Adilabad town and urban clusters foster Muslim–Hindu interactions, with local mosques serving as cultural hubs during Ramadan and Eid festivals.
Bhadradri Kothagudem (5.62%): With 1,115,724 residents and 62,672 Muslims, Kothagudem’s coal and power industries draw Muslim workers in mining, logistics, and utilities. Settlements around Kothagudem town see mosques integrated into cityscapes. Community life revolves around Urs festivals at local dargahs, while rural pockets maintain lower proportions owing to tribal majorities and agrarian livelihoods.
Hyderabad (43.45%): Hyderabad’s 3,943,323 residents include 1,713,405 Muslims, the highest share regionally, rooted in centuries of Qutb Shahi and Asaf Jahi rule. The Old City thrives on bazaars, pearl trade, and charminar-era heritage. Today, Muslims excel in government service, education, and small‐scale industries. Iconic mosques like Mecca Masjid anchor vibrant religious life, while modern institutions nurture socio‐economic mobility.
Jagtial (7.78%): Jagtial, with 988,913 population and 76,952 Muslims, centers on rice mills and oil extraction. Muslim communities cluster in Jagtial town, engaging in milling businesses, transport, and trade. Mosques and Urdu-medium schools provide religious and linguistic education. While agrarian rhythms dominate, urbanization brings better healthcare and schooling for the minority community.
Jangaon (3.19%): Jangaon’s 561,422 people include only 17,899 Muslims. A small district carved from Warangal, its rural economy—cotton, paddy, and cattle—provides limited opportunities for Muslims. Most work in small shops, driving transport services, or as seasonal laborers. Communal ties revolve around a few mosques in Jangaon town, strengthening identity amid Hindu‐majority villages.
Jayashankar Bhupalpally (2.95%): With 410,963 residents and 12,130 Muslims, Bhupalpally’s tribal forests and coalfields host a tiny Muslim presence. Predominantly agrarian, Muslims here engage in manual labor, small retail, and transport. Limited infrastructure confines them to Bhupalpally town clusters. Mosques serve scant congregations, reflecting a community navigating marginal footholds.
Jogulamba Gadwal (7.96%): Gadwal’s 609,990 population includes 48,557 Muslims engaged in textile weaving, rice trade, and peri‐urban services. Famous for Gadwal sarees, local Muslim weavers sustain historic crafts alongside Hindu artisans. Community festivals blend seamlessly, with Eid and Diwali celebrated in shared public spaces, reinforcing social cohesion.
Kamareddy (10.22%): Kamareddy, home to 974,227 people including 99,572 Muslims, straddles Hyderabad’s rural fringe. Agriculture and granite mining define its economy, with Muslims working as traders, quarry supervisors, and transporters. Mosques in Kamareddy town anchor communal life, while diaspora networks link to Gulf remittances boosting local development.
Karimnagar (8.63%): Karimnagar’s 983,931 residents include 84,953 Muslims. Known for granite and rice industries, Muslims engage in stone cutting, milling, and trade. Historic forts and mosques in town provide cultural focal points. Muslim madrasa education coexists with secular schools, enhancing literacy and livelihoods in urban and surrounding rural areas.
Khammam (6.05%): Khammam, with 1,545,480 residents and 93,442 Muslims, thrives on coal and cement industries. Muslim laborers and small‐scale entrepreneurs staff factories and shops. Ghats on the Godavari host joint festivals, fostering interfaith ties. Community organizations run health camps and vocational training, promoting socio‐economic upliftment.
Komaram Bheem (Asifabad) (8.11%): Asifabad’s 520,719 people include 42,218 Muslims. Tribal and forested, its small Muslim population works in forestry services, trade, and seasonal labor. Weekly bazaars in Asifabad town unite diverse communities, with mosques serving as both prayer and community centers.
Mahabubabad (3.32%): Mahabubabad’s 754,845 population houses 25,026 Muslims, largely in cotton and mango cultivation areas. Most work as laborers or small‐shop owners in town clusters. Limited mosque infrastructure means communal life centers on private gatherings during Ramadan and Eid.
Mahbubnagar (10.23%): With 1,471,205 residents and 150,453 Muslims, Mahbubnagar balances agriculture, granite mining, and service trades. Muslims run rice mills, transport logistics, and retail shops. Historic mosques in Gadwal and Wanaparthy host vibrant festivals, underscoring long‐standing cultural footprints.
Mancherial (5.60%): Mancherial’s 802,130 people include 44,944 Muslims, many employed in Singareni coal mines and thermal power plants. Labor colonies around mandals foster community bonds, with mosques and madrasas supporting religious education. Seasonal fairs blend tribal and Muslim traditions.
Medak (6.81%): Medak, population 801,131 with 54,549 Muslims, is known for its historic cathedral and regional markets. Muslims here engage in grain trade, weaving, and transport. Urban clusters around Medak town provide better schooling and healthcare, reflected in higher literacy among Muslim youth.
Medchal Malkajgiri (9.24%): As part of the Hyderabad metro, this district’s 2,440,073 residents include 225,377 Muslims. Rapid urban sprawl brings employment in IT parks, manufacturing, and services. Muslim neighborhoods in Sitaphalmandi and Malkajgiri maintain strong community NGOs focused on education and women’s empowerment.
Mulugu (3.35%): Mulugu’s 300,471 people include only 10,064 Muslims, primarily from tribal backgrounds working in forest produce and minor trade. Sparse infrastructure keeps mosques few; communal life centers on home‐based gatherings and itinerant religious teachers.
Nagarkurnool (6.08%): Nagarkurnool’s 662,455 residents include 40,262 Muslims engaged in paddy farming, granite quarries, and small businesses. Mosques in district headquarters serve as community hubs, with modest educational institutions supporting youth development.
Nalgonda (5.79%): Nalgonda’s 1,646,694 people include 95,407 Muslims working in cement plants, agriculture, and local trade. Rural townships host weekly markets blending Hindu and Muslim vendors. Community-led health and literacy camps bolster social integration.
Narayanpet (8.47%): Narayanpet, population 569,942 with 48,286 Muslims, is famous for its handloom saris. Muslim weavers form cooperatives, exporting textiles globally. Cultural festivals patronize joint celebrations, reflecting deep artisanal collaboration.
Nirmal (14.04%): Nirmal’s 709,418 residents include 99,600 Muslims who contribute to famed Nirmal painting, toys, and handicrafts. Muslim artisans work alongside Hindu counterparts, and mosques host community art workshops, promoting cultural synergy.
Nizamabad (18.52%): Nizamabad’s 1,577,108 people include 292,024 Muslims, a legacy of Nizam-era rule. The district’s rice and turmeric markets are dominated by Muslim traders. Historic mosques and dargahs draw pilgrims from across Telangana.
Peddapalli (6.03%): Peddapalli, with 791,836 residents and 47,714 Muslims, hosts coal mines and thermal plants. Muslims here work as laborers, transporters, and small-business owners. Town mosques coordinate vocational training programs for community upliftment.
Rajanna Sircilla (4.03%): Sircilla’s 548,850 people include 22,140 Muslims in textile clusters. Known as the “Manchester of Telangana,” its power looms and dyeing units employ Muslim families. Community centers provide skill training and microfinance support.
Rangareddy (13.62%): Surrounding Hyderabad, Rangareddy’s 2,071,666 residents include 282,120 Muslims engaged in real estate, services, and industry. Rapid urbanization drives diverse employment, while traditional mosques co-exist with modern community halls.
Sangareddy (16.15%): Sangareddy, population 1,495,503 with 241,560 Muslims, thrives on pharmaceutical, textile, and agro-industries. Muslim entrepreneurs lead in turmeric trade and garment manufacturing. Festivals blend rural and urban customs.
Siddipet (5.41%): Siddipet’s 1,023,577 people include 55,408 Muslims in paddy cultivation and granite quarries. Small business clusters in Siddipet town support trade, while mosques host literacy drives and health camps.
Suryapet (5.96%): Suryapet’s 1,144,618 residents include 68,168 Muslims working in textile mills, rice mills, and transport. Community organizations run interfaith events, reinforcing social harmony amid agrarian livelihoods.
Vikarabad (12.94%): Vikarabad’s 946,109 people include 122,448 Muslims, many in horticulture and peri-urban services. Historic forts and mosques attract cultural tourism. Community welfare trusts sponsor education for underprivileged youth.
Wanaparthy (5.91%): Wanaparthy’s 578,329 residents include 34,187 Muslims in paddy and sugarcane farming. Seasonal labor migration to cities supplements incomes. Town mosques facilitate communal gatherings during festivals.
Warangal Rural (3.57%): The rural district’s 759,300 people include 27,120 Muslims, mostly in agriculture and brick kilns. Limited urban centers mean small congregations; religious life revolves around village mosques and itinerant clergy.
Warangal Urban (10.77%): Warangal city’s 1,037,557 residents include 111,763 Muslims. Historic architecture—forts and mosques—attract tourism. Muslims here engage in education, services, and small industries, balancing heritage with modernization.
Yadadri Bhuvanagiri (3.59%): Home to 697,497 people and 25,071 Muslims, Yadadri’s economy centers on pilgrimage tourism and agriculture. Muslim communities serve pilgrims through lodging, transport, and eateries, fostering interfaith engagement.
Muslim Population by District in Telangana (2011 Census)
References
- Census of India. C-01: Population by religious community, Goa – 2011. Available at: https://censusindia.gov.in/nada/index.php/catalog/study/PC11_C01-30
- Census of India. C-17: Primary Census Abstract, Telangana – 2011.
- Government of Telangana. Economic Survey 2012–13. Hyderabad, 2013.
- Government of Telangana. Economic Survey 2012–13. Hyderabad, 2013.
Religion
Muslim Population in Karnataka (2025 Update): District-Wise Data, Percentage & Analysis
Published
11 months agoon
August 8, 2025Excerpt: Karnataka, a state in southwest India known for its technological hubs, silk production, and rich heritage, hosts a significant Muslim community alongside its Hindu majority. Spread across coastal, northern, and central regions, Karnataka’s Muslims contribute to the state’s economy through trade, education, and industry, while preserving cultural traditions in urban and rural settings.
According to the 2011 Census, Karnataka’s total population stands at approximately 61,095,297, of which 7,893,065 are Muslims, forming 12.92% of the state’s population[5][6]
Kannada is the lingua franca, while Urdu remains culturally significant among Muslim communities. Urban centers like Bangalore and Belgaum display higher Muslim engagement in IT, education, and commerce, whereas rural and northern districts rely on agriculture, handicrafts, and small-scale trade.
Top 10 Districts by Muslim Population in Karnataka
The above districts in the chart with the highest share of Muslims in Karnataka show how history, trade, and jobs have shaped the population. Dakshina Kannada (24.02%) is highest due to its coastal trade links with Arab merchants. Gulbarga and Dharwad have high shares because of their Muslim rulers in the past. In places like Haveri, Bijapur, and Raichur, many Muslims work in farming and crafts. In Kodagu and Bellary, they work in plantations and mines. These areas also have strong community institutions.
The above districts in the chart with the lowest Muslim population share in Karnataka are mostly rural and agrarian. Mandya (4.31%) and Chamarajanagar (4.62%) have limited urbanization and smaller Muslim communities engaged in farming and local trade. Districts like Hassan, Chitradurga, and Udupi also have low Muslim presence due to historical Hindu dominance and fewer migration patterns. Bangalore Rural, Tumkur, and Vijaynagara show slightly higher shares due to proximity to cities or mixed economies, but overall, these areas have minimal Muslim cultural influence.
Mandya (4.31%), Chamarajanagar (4.62%), and Hassan (6.76%) record the lowest Muslim proportions, reflecting historic agrarian patterns and limited urbanization.
Total Muslim vs Non-Muslim Population in Karnataka (2011 Census)
Muslims constitute 12.92% of Karnataka’s population, while non-Muslims account for 87.08%, highlighting a notable minority presence across diverse districts.
Muslim vs Hindu Population in Karnataka (2001 & 2011 Census)
Between 2001 and 2011, Karnataka’s Muslim population grew by 22.12%, outpacing Hindu growth of 15.79%, driven by urban migration and higher natural growth in northern and coastal pockets[7]
Districts with Highest Muslim Density per 100,000 People in Karnataka
Coastal Dakshina Kannada and central Dharwad boast the highest Muslim densities, reflecting historic trading hubs and industrial centers.
Small Population Districts with Low Muslim Percentage
Kodagu, Udupi, and Chikmagalur, though smaller in population, maintain below-average Muslim shares, influenced by local agrarian and plantation economies.
Belgaum: With 4,779,661 residents, Belgaum houses 528,412 Muslims (11.06%). Nestled at Karnataka’s northern border, it blends textile, agriculture, and stone-cutting industries. Muslims engage in trade, education, and transport services. The region’s syncretic culture is palpable during Ramadan and Eid gatherings across city mosques and rural madrasas.
Bagalkot: Bagalkot’s 1,889,752 population includes 219,991 Muslims (11.64%). Known for its limestone and agriculture, Muslims here run tile works, shops, and small eateries. Community life centers around local dargahs, with festivals like Urs and Eid drawing devotees from neighboring villages.
Bijapur: Bijapur reports 2,177,331 people, with 369,588 Muslims (16.97%). Famous for its Gol Gumbaz and historical sultanate remnants, the district’s Muslim artisans flourish in stone carving, tailoring, and small-scale tourism. Religious tourism sustains many families, bolstering local markets.
Bidar: Bidar’s 1,703,300 residents include 335,184 Muslims (19.68%), the second-highest share in the state. Renowned for its Bidriware handicrafts, Muslims dominate metal inlay workshops and carpet weaving. Community bonds strengthen during Muharram processions and urs at Sufi shrines.
Raichur: Among 1,928,812 people, Raichur hosts 272,022 Muslims (14.10%). An agrarian district straddling the Krishna River, Muslims engage in paddy cultivation, trade of agricultural inputs, and small transport businesses. Friday prayers in Raichur town unite diverse sub-communities.
Koppal: Koppal’s 1,389,920 population includes 161,770 Muslims (11.64%). With its rich temple architecture and mining sites, the district’s Muslims are employed in service trades, goldsmithing, and local commerce. Communal harmony is evident during shared harvest festivals.
Gadag: Out of 1,064,570 inhabitants, 143,665 are Muslims (13.50%). Gadag’s textile mills and agricultural markets employ many Muslims as traders, weavers, and transporters. Community centers offer madrasas and vocational training, strengthening youth engagement.
Dharwad: Dharwad counts 1,847,023 people, with 386,834 Muslims (20.94%), the highest share in the state. Known for its educational institutions, Muslims participate actively as students and faculty. The district’s cultural festivals showcase Qawwali performances and interfaith music events.
Uttara Kannada: Uttara Kannada’s 1,437,169 population includes 187,974 Muslims (13.08%). Coastal ports and fishing hubs employ Muslims in marine trade, shipbuilding, and fisheries commerce. Eid al-Fitr celebrations see communal feasts along the Arabian Sea coast.
Haveri: With 1,597,668 residents, Haveri has 297,927 Muslims (18.65%). A hub for cotton ginning and oil mills, Muslims here own and operate several agro-based businesses. Friday congregations at historic mosques bind urban and rural congregants alike.
Bellary: Bellary’s 1,300,246 population includes 195,146 Muslims (15.01%). Mining and steel industries attract Muslim labor, entrepreneurs, and traders. Community welfare associations run vocational centers, promoting skill development among youth.
Chitradurga: Among 1,659,456 people, Chitradurga has 128,751 Muslims (7.76%), one of the lower shares. Known for its fortress and granite trade, Muslims run small quarries, tailoring shops, and local eateries. Intercommunity markets foster social cohesion.
Davanagere: Davanagere’s 1,643,494 residents include 237,747 Muslims (14.47%). Known as the “Manchester of Karnataka” for its cotton mills, Muslims engage in textile trading, road transport, and garment manufacturing. Religious schools complement secular education in urban pockets.
Shimoga: Shimoga’s 1,752,753 population hosts 234,664 Muslims (13.39%). With forestry and hydropower projects, Muslims take roles in administration, trade, and service sectors. Eid processions weave through the scenic Tunga River banks.
Udupi: Udupi, with 1,177,361 people, includes 96,740 Muslims (8.22%). A coastal temple town renowned for cuisine, Muslims run seafood businesses, hotels, and pilgrim services. Interfaith dining experiences during Ramadan draw locals and visitors alike.
Chikmagalur: Chikmagalur, with 1,137,961 residents, counts 101,235 Muslims (8.90%). Renowned for its coffee plantations and hill stations, Muslims participate in plantation labor, small-scale hospitality, and café businesses. Local mosques in Kadur and Mudigere host seasonal festivals, while younger generations engage in hospitality and eco‐tourism ventures.
Tumkur: Tumkur’s 2,678,980 population includes 245,923 Muslims (9.18%). An industrially diversified district on the Bangalore highway, Muslims work in manufacturing units, transport logistics, and roadside businesses. Community centers in Tumakuru town provide vocational training and religious education, fostering socio‐economic upliftment.
Bangalore Urban: Karnataka’s capital region, with 9,621,551 people, has 1,248,294 Muslims (12.97%). As an IT and service hub, Muslims excel in professional services, entrepreneurship, and academia. Prominent mosques in Shivajinagar and Frazer Town host major Eid congregations. Community NGOs also run skill‐development and women’s empowerment programs.
Mandya: Mandya’s agrarian landscape of 1,805,769 inhabitants includes 77,801 Muslims (4.31%), the lowest share in the state. Muslims here predominantly engage in livestock rearing, sugarcane trade, and small retail outlets. The community observes collective iftars during Ramadan, strengthening ties with Hindu neighbors.
Hassan: Hassan’s 1,776,421 people encompass 120,011 Muslims (6.76%). Known for its temple architecture and coffee estates, Muslims here manage plantation labor, small hotels, and local transport. Community life revolves around mosques in Hassan city and spiritual gatherings at Urs festivals.
Dakshina Kannada: Home to 2,089,649 residents, including 501,896 Muslims (24.02%), the highest share in Karnataka, this coastal district thrives on fisheries, cashew processing, and port trade. Muslims dominate medium‐scale commerce and logistics in Mangalore. Annual cultural events like Yakshagana include significant Muslim participation.
Kodagu: In Kodagu’s 554,519 population, 87,274 are Muslims (15.74%). Known for coffee and spice plantations, Muslims work as plantation supervisors, café owners, and guides. Community halls in Madikeri host interfaith cultural evenings, reflecting peaceful coexistence.
Mysore: Mysore, with 3,001,127 inhabitants, has 290,549 Muslims (9.68%). Famous for its palace and silk industry, Muslims contribute to silk weaving, power‐loom operations, and tourism services. The annual Mysore Dasara sees Muslim artisans crafting festival paraphernalia alongside Hindu artisans.
Chamarajanagar: Chamarajanagar’s 1,020,791 people include 47,210 Muslims (4.62%). A predominantly rural district near the Tamil Nadu border, Muslims engage in cattle trade, forest produce commerce, and small shops. Friday bazaars in towns like Kollegal facilitate intercultural exchange.
Gulbarga: Gulbarga (Kalaburagi), with 2,566,326 residents, counts 513,125 Muslims (19.99%). A historic Sultanate seat, Muslims here dominate tile manufacturing, brick kilns, and wholesale trade. Religious education flourishes in madrasas, and Sufi shrines draw pilgrims across the Deccan.
Yadgir: Yadgir’s 1,174,271 population includes 155,340 Muslims (13.23%). An agro‐industrial district, Muslims work in rice mills, textile looms, and transport services. Community-driven health camps and literacy programs operate from mosque complexes.
Kolar: Of 1,536,401 inhabitants, 199,873 are Muslims (13.01%). Formerly a gold‐mining hub, today its Muslims run goldsmith workshops, retail jewelry, and agricultural supply stores. Community Eid melas (fairs) foster interreligious harmony in Kolar town.
Chikkaballapura: Chikkaballapura’s 1,255,104 people include 147,810 Muslims (11.78%). Near Bangalore, Muslims engage in dairy production, sericulture, and commuting to urban jobs. Mosque committees here focus on youth mentorship and sports activities.
Bangalore Rural: In the rural periphery of 990,923 people, 92,252 are Muslims (9.31%). Engaged in agriculture, stone quarrying, and peri‐urban services, Muslims commute to Bangalore Urban for work. Community centers offer language classes and microfinance support.
Ramanagara: Ramanagara’s 1,082,636 residents include 114,311 Muslims (10.56%). Known for its silk cocoons and granite quarries, Muslims run cocoon‐trading businesses and stone‐cutting workshops. Interfaith cultural festivals in Ramanagara town bring communities together.
Vijaynagara: Vijaynagara’s 1,454,352 people include 153,746 Muslims (10.57%). A newly formed district with heritage ruins, Muslims here participate in tourism services, agriculture, and local handicrafts. Community youth groups organize educational workshops in Hoovina Hadagalli and Hampi taluks.
Muslim Population by District in Karnataka (2011 Census)
References
- Census of India. C-01: Population by religious community, Goa – 2011. Available at: https://censusindia.gov.in/nada/index.php/catalog/study/PC11_C01-30
- Census of India. C-17: Primary Census Abstract, Telangana – 2011.
- Government of Telangana. Economic Survey 2012–13. Hyderabad, 2013.
- Government of Telangana. Economic Survey 2012–13. Hyderabad, 2013.
- Census of India. C-17: Primary Census Abstract, Karnataka – 2011.
- Centre for Policy Studies. Religious Demography of Karnataka, 2001–11. 2023.
- Centre for Policy Studies. Religious Demography of Karnataka, 2001–11. 2023.

Muslim Population in Goa (2025 Update): District-Wise Data, Percentage & Analysis

Muslim Population in Telangana (2025 Update): District-Wise Data, Percentage & Analysis

Muslim Population in Karnataka (2025 Update): District-Wise Data, Percentage & Analysis

Trump’s 2025 Tariffs on India Explained: Full List, Dates, Products, and 50% Duty Impact

Muslim Population in Odisha (2025 Update): District-Wise Data, Percentage & Analysis
Muslim Population in Goa (2025 Update): District-Wise Data, Percentage & Analysis
Muslim Population in Telangana (2025 Update): District-Wise Data, Percentage & Analysis
Muslim Population in Karnataka (2025 Update): District-Wise Data, Percentage & Analysis


Trending
- Technology2 years ago
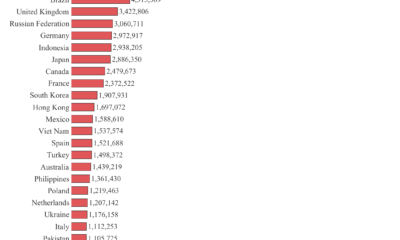
Highest number of software developers by country in the world 2023 by GitHub | Data Player
- Religion2 years ago
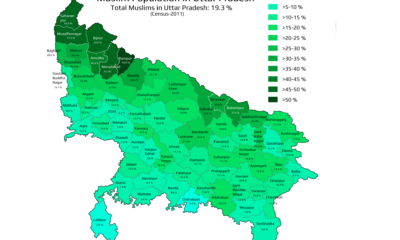
Mapped: What are the muslims population in Uttar Pradesh | State of India
- Economy3 years ago
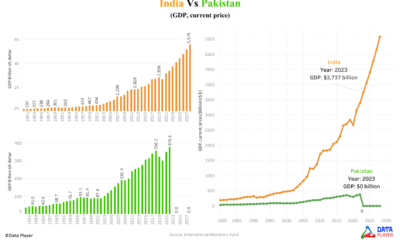
Why Pakistan’s economy is drowning while India’s economy is touching the sky
- Demographics2 years ago
Mapped: Average Working Hours by European Countries in 2024
- Religion2 years ago
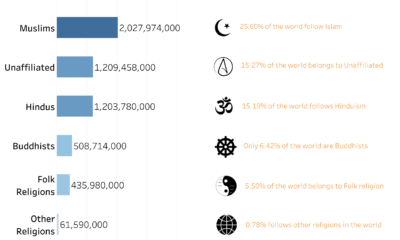
World’s Largest Religion in 2024 | Data Player
- Religion2 years ago
Mapped: What is Muslim Population in West Bengal by District wise 2011
- Demographics3 years ago
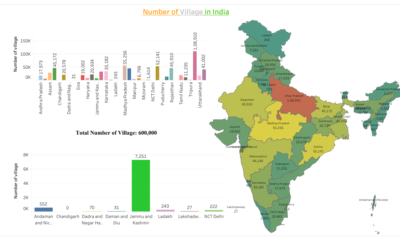
What are the Number of Villages in India by its State and Union Territory
- Demographics3 years ago
Massive population size by Indian states 2023