Economy
Millionaires on the Move: Where the Wealthy Are Relocating in 2024 and Why?
| Country | Bar | Inflows |
|---|---|---|
 United Arab Emirates
 | +6,700 | +6,700 |
 United States of America
 | +3,800 | +3,800 |
 Singapore
 | +3,500 | +3,500 |
 Canada
 | +3,200 | +3,200 |
 Australia
 | +2,500 | +2,500 |
 Italy
Italy | +2,200 | +2,200 |
 Switzerland
 | +1,500 | +1,500 |
 Greece
 | +1,200 | +1,200 |
 Portugal
 | +800 | +800 |
 Japan
Japan | +400 | +400 |
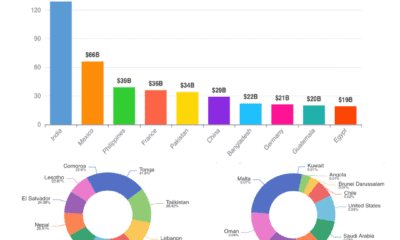
The UAE is the top place for millionaires moving in 2024. It has no income tax, offers golden visas, a luxurious lifestyle, and a great location. It’s expected to attract almost twice as many millionaires as the US, which is the next popular choice with 3,800 millionaires moving there.
Singapore maintains its 3rd position this year with a net inflow of 3,500 millionaires, while Canada and Australia continue as popular choices, ranking 4th and 5th with net inflows of 3,200 and 2,500 millionaires respectively. In Europe, Italy (+2,200), Switzerland (+1,500), Greece (+1,200), and Portugal (+800) also secure spots in the Top 10 for net millionaire inflows in 2024. Additionally, Japan is set to welcome 400 wealthy migrants, driven partly by a growing trend of Chinese high-net-worth individuals relocating to Tokyo following the Covid-19 pandemic.
In Europe, Italy (+2,200), Switzerland (+1,500), Greece (+1,200), and Portugal (+800) are notable destinations among the top 10 for net millionaire inflows. Japan is also set to welcome +400 wealthy migrants, fueled in part by an increasing trend of Chinese high-net-worth individuals relocating to Tokyo post-Covid-19. These trends underscore a dynamic global landscape where tax incentives, quality of life, and strategic locations play pivotal roles in millionaire migration patterns.


Economy
Is India Really a ‘Dead Economy’? A Deep Dive Into the Facts Trump Didn’t Mention
When Donald Trump recently called India a “dead economy,” it sparked global headlines and trended across social media. For many, this bold remark raised questions — is there any truth to it? Is India really falling behind, or is something else happening beneath the surface?
References
- Wikipedia. Tariffs in the Second Trump Administration. Available at: https://en.wikipedia.org/wiki/Tariffs_in_the_second_Trump_administration
- Times of India. India-US trade deal: Trump announces 25% tariff on India. Available at: https://timesofindia.indiatimes.com/business/india-business/india-us-trade-deal-trump-announces-25-tariff-on-india-plus-penalty-for-buying-energy-and-arms-from-russia/articleshow/122998698.cms
- Reuters. Trump imposes extra 25% tariff on Indian goods. Available at: https://www.reuters.com/world/india/trump-imposes-extra-25-tariff-indian-goods-ties-hit-new-low-2025-08-06/
- IndiaTimes. Donald Trump’s India tariffs set to hit US shoppers hard. Available at: https://indiatimes.com/trending/donald-trumps-india-tariffs-set-to-hit-us-shoppers-hard-phones-auto-parts-jeans-jewellery-to-get-costlier-665564.html
- Al Jazeera. Trump imposes 25 percent tariff on Indian goods over Russian oil. Available at: https://www.aljazeera.com/news/2025/8/6/trump-imposes-25-percent-tariff-on-indian-goods-over-russian-oil
- Economic Times. India reacts to 50% US tariffs. Available at: https://economictimes.indiatimes.com/news/economy/foreign-trade/trump-tariff-from-50-on-india-and-brazil-to-35-on-canada-heres-how-nations-stack-up-in-comparison/articleshow/123145315.cms
- Khandekar, N. (2025). India to remain fastest growing major eco with 6.5% growth in FY26: IMF. [online] The Economic Times. Available at: https://economictimes.indiatimes.com/news/economy/indicators/india-to-remain-fastest-growing-major-eco-with-6-5-growth-in-fy26-imf/articleshow/118649360.cms.
- World Bank (2023). Population, Total. [online] The World Bank. Available at: https://data.worldbank.org/indicator/SP.POP.TOTL.
- CIA (2024). Median age – The World Factbook. [online] www.cia.gov. Available at: https://www.cia.gov/the-world-factbook/field/median-age/country-comparison/.
- UN Comtrade. (2024). Available at: https://comtrade.un.org [Accessed 25 Jul. 2025].
- ITC Trade Map. (2024). Available at: https://www.trademap.org [Accessed 22 Jul. 2025].

Muslim Population in Goa (2025 Update): District-Wise Data, Percentage & Analysis

Muslim Population in Telangana (2025 Update): District-Wise Data, Percentage & Analysis

Muslim Population in Karnataka (2025 Update): District-Wise Data, Percentage & Analysis

Trump’s 2025 Tariffs on India Explained: Full List, Dates, Products, and 50% Duty Impact

Muslim Population in Odisha (2025 Update): District-Wise Data, Percentage & Analysis
Muslim Population in Goa (2025 Update): District-Wise Data, Percentage & Analysis
Muslim Population in Telangana (2025 Update): District-Wise Data, Percentage & Analysis
Muslim Population in Karnataka (2025 Update): District-Wise Data, Percentage & Analysis


 Technology2 years ago
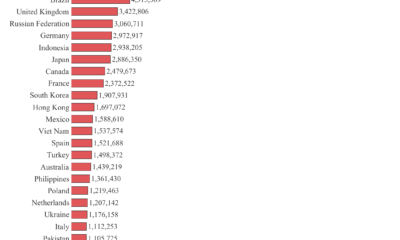
Highest number of software developers by country in the world 2023 by GitHub | Data Player
- Religion2 years ago
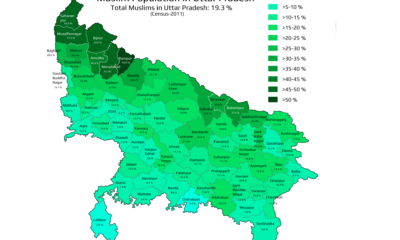
Mapped: What are the muslims population in Uttar Pradesh | State of India
- Economy3 years ago
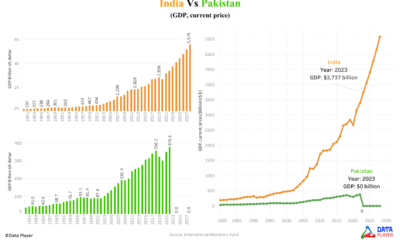
Why Pakistan’s economy is drowning while India’s economy is touching the sky
- Demographics2 years ago
Mapped: Average Working Hours by European Countries in 2024
- Religion2 years ago
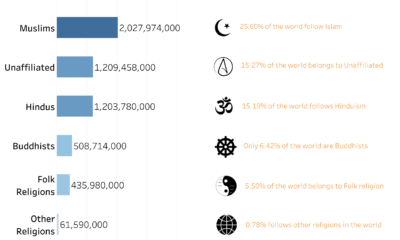
World’s Largest Religion in 2024 | Data Player
- Religion2 years ago
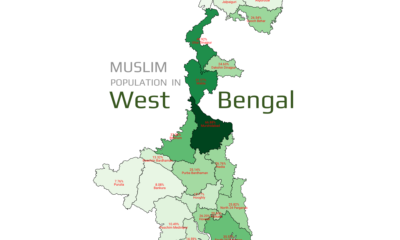
Mapped: What is Muslim Population in West Bengal by District wise 2011
- Demographics3 years ago
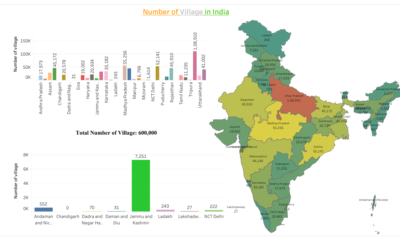
What are the Number of Villages in India by its State and Union Territory
- Demographics3 years ago
Massive population size by Indian states 2023