


Economy
Is India Really a ‘Dead Economy’? A Deep Dive Into the Facts Trump Didn’t Mention
When Donald Trump recently called India a “dead economy,” it sparked global headlines and trended across social media. For many, this bold remark raised questions — is there any truth to it? Is India really falling behind, or is something else happening beneath the surface?
References
- United Nations (2024). World Population Prospects 2024. [online] United Nations. Available at: https://population.un.org/wpp/.
- Keelery, S. (2023). India – number of internet users 2023 | Statistic. [online] Statista. Available at: https://www.statista.com/statistics/255146/number-of-internet-users-in-india/.
- World Bank (2024). Global Economic Prospects. [online] World Bank. Available at: https://www.worldbank.org/en/publication/global-economic-prospects.
- Reuters. (n.d.). Latest India News | Today’s Top Stories. [online] Available at: https://www.reuters.com/world/india/.
- United Nations (2024). World Population Prospects 2024. [online] United Nations. Available at: https://population.un.org/wpp/.
- IMF (2024). World Economic Outlook. [online] International Monetary Fund. Available at: https://www.imf.org/en/publications/weo.
- Bloomberg.com. (2025). China Has Record Foreign Investment Outflow as $168 Billion Exit. [online] Available at: https://www.bloomberg.com/news/articles/2025-02-14/china-has-record-foreign-investment-outflow-as-168-billion-exit.
- IMF (2024). World Economic Outlook, April 2024. [online] International Monetary Fund. Available at: https://www.imf.org/en/Publications/WEO/Issues/2024/04/16/world-economic-outlook-april-2024.
- Wikipedia. Tariffs in the Second Trump Administration. Available at: https://en.wikipedia.org/wiki/Tariffs_in_the_second_Trump_administration
- Times of India. India-US trade deal: Trump announces 25% tariff on India. Available at: https://timesofindia.indiatimes.com/business/india-business/india-us-trade-deal-trump-announces-25-tariff-on-india-plus-penalty-for-buying-energy-and-arms-from-russia/articleshow/122998698.cms
- Reuters. Trump imposes extra 25% tariff on Indian goods. Available at: https://www.reuters.com/world/india/trump-imposes-extra-25-tariff-indian-goods-ties-hit-new-low-2025-08-06/
- IndiaTimes. Donald Trump’s India tariffs set to hit US shoppers hard. Available at: https://indiatimes.com/trending/donald-trumps-india-tariffs-set-to-hit-us-shoppers-hard-phones-auto-parts-jeans-jewellery-to-get-costlier-665564.html
- Al Jazeera. Trump imposes 25 percent tariff on Indian goods over Russian oil. Available at: https://www.aljazeera.com/news/2025/8/6/trump-imposes-25-percent-tariff-on-indian-goods-over-russian-oil
- Economic Times. India reacts to 50% US tariffs. Available at: https://economictimes.indiatimes.com/news/economy/foreign-trade/trump-tariff-from-50-on-india-and-brazil-to-35-on-canada-heres-how-nations-stack-up-in-comparison/articleshow/123145315.cms
- Khandekar, N. (2025). India to remain fastest growing major eco with 6.5% growth in FY26: IMF. [online] The Economic Times. Available at: https://economictimes.indiatimes.com/news/economy/indicators/india-to-remain-fastest-growing-major-eco-with-6-5-growth-in-fy26-imf/articleshow/118649360.cms.
- World Bank (2023). Population, Total. [online] The World Bank. Available at: https://data.worldbank.org/indicator/SP.POP.TOTL.
- CIA (2024). Median age – The World Factbook. [online] www.cia.gov. Available at: https://www.cia.gov/the-world-factbook/field/median-age/country-comparison/.
- UN Comtrade. (2024). Available at: https://comtrade.un.org [Accessed 25 Jul. 2025].
- ITC Trade Map. (2024). Available at: https://www.trademap.org [Accessed 22 Jul. 2025].

Muslim Population in Goa (2025 Update): District-Wise Data, Percentage & Analysis

Muslim Population in Telangana (2025 Update): District-Wise Data, Percentage & Analysis

Muslim Population in Karnataka (2025 Update): District-Wise Data, Percentage & Analysis

Trump’s 2025 Tariffs on India Explained: Full List, Dates, Products, and 50% Duty Impact

Muslim Population in Odisha (2025 Update): District-Wise Data, Percentage & Analysis
Muslim Population in Goa (2025 Update): District-Wise Data, Percentage & Analysis
Muslim Population in Telangana (2025 Update): District-Wise Data, Percentage & Analysis
Muslim Population in Karnataka (2025 Update): District-Wise Data, Percentage & Analysis


 Technology2 years ago
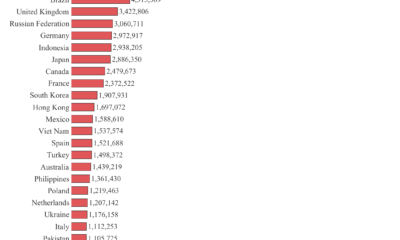
Highest number of software developers by country in the world 2023 by GitHub | Data Player
- Religion2 years ago
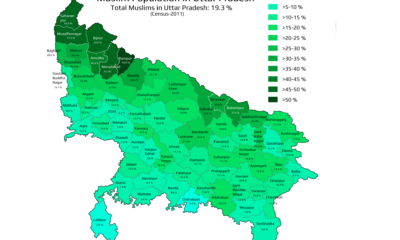
Mapped: What are the muslims population in Uttar Pradesh | State of India
- Economy3 years ago
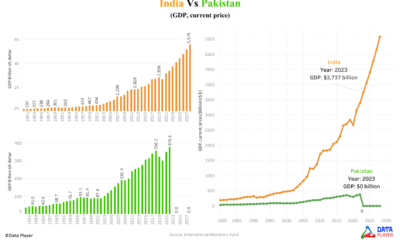
Why Pakistan’s economy is drowning while India’s economy is touching the sky
- Demographics2 years ago
Mapped: Average Working Hours by European Countries in 2024
- Religion2 years ago
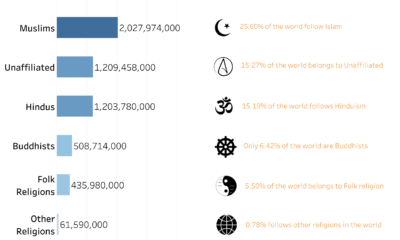
World’s Largest Religion in 2024 | Data Player
- Religion2 years ago
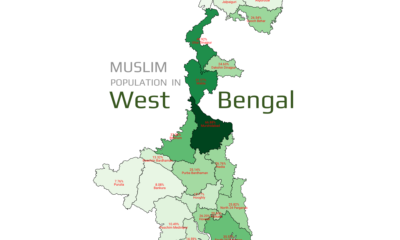
Mapped: What is Muslim Population in West Bengal by District wise 2011
- Demographics3 years ago
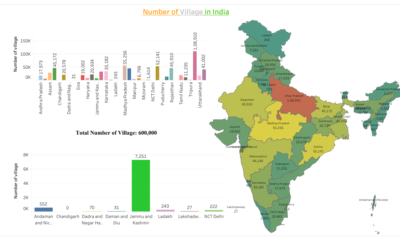
What are the Number of Villages in India by its State and Union Territory
- Demographics3 years ago
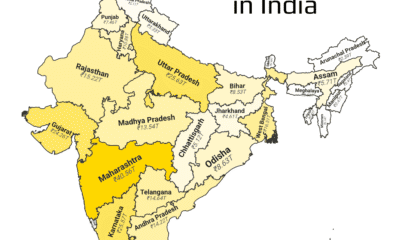
Massive population size by Indian states 2023