Connect with us

Economy

India’s Booming Economy: Rising to the Top

Published

on

India’s Place in the World Economy

GDP, or Gross Domestic Product, tells us how much money a country makes from making and selling things. A bigger GDP means a stronger economy.

India is doing great! It’s ranked 4th in the world for its big, growing economy. That puts it ahead of Japan. We even might become number 3 in a few years!

Top 10 Largest Economies in 2025

RankCountryContinentGDP (USD)GDP Per Capita (Current Prices) (USD)
1United States of AmericaNorth America$30.51 trillion$89.11 thousand
2ChinaAsia$19.23 trillion$13.69 thousand
3GermanyEurope$4.74 trillion$55.91 thousand
4IndiaAsia$4.19 trillion$2.88 thousand
5JapanAsia$4.19 trillion$33.96 thousand
6United Kingdom (U.K.)Europe$3.84 trillion$54.95 thousand
7FranceEurope$3.21 trillion$46.39 thousand
8ItalyEurope$2.42 trillion$41.09 thousand
9CanadaNorth America$2.23 trillion$53.56 thousand
10BrazilSouth America$2.13 trillion$9.96 thousand

*This data is based on IMF Projections*

Advertisement

India’s Economic Strengths

India is growing because of many things:

  • Farming, both traditional and modern
  • Technology services
  • Handmade crafts
  • Helping other companies with their work

India’s GDP Per Capita

GDP per capita is the average amount of money each person makes.

India’s GDP per capita is still lower than some other countries, but it’s increasing!

YearPer Capita Income (Indian Rupees)
2015Rs. 86,647
2023Rs. 1.6 lakh
2024Rs. 1.8 lakh
2025Rs. 2.4 lakh (approx)

India is doing well, and its economy will keep growing!

Advertisement
Continue Reading
Advertisement
Click to comment

Leave a Reply

Your email address will not be published. Required fields are marked *

Economy

Where Europe Needs to Invest: Ranking the Sectors with the Biggest Infrastructure Gaps

Published

on

Excerpt: Europe is facing a staggering infrastructure investment gap that could reach $2 trillion by 2040. This blog breaks down which sectors—from roads and rail to telecommunications—require the most urgent financial attention to ensure economic resilience and future growth.

Europe’s $2 Trillion Infrastructure Deficit: A Sectoral Breakdown

As Europe modernizes its economy and pushes toward climate and digital goals, its infrastructure is falling behind. According to data from Infrastructure Outlook, the continent is expected to face a $2 trillion infrastructure investment shortfall by 2040—a dramatic rise from $538 billion in 2024.

However, the shortfall is not equally distributed across sectors. Some areas are far more underfunded than others, particularly those tied to transportation and energy. Let’s look at which sectors are most in need of urgent investment.

Advertisement

Investment Gap by Sector: Europe

SectorEstimated Infrastructure Gap ($ Billion)
Road881
Rail603
Energy250
Ports121
Airports81
Telecommunications46
Water9

Top Priorities: Roads, Rail, and Energy

Transportation infrastructure dominates the list. Roads alone account for a $881 billion shortfall, followed by rail with a $603 billion deficit. These sectors are essential not only for regional connectivity but also for reducing emissions through better public transport networks and modernized logistics systems.

Coming in third is the energy sector, which requires an estimated $250 billion in additional funding. This investment is vital for supporting the EU’s goal to reach net-zero carbon emissions by 2050 through renewable energy sources, smart grids, and storage technologies.

Telecom and Digital Gaps

Telecommunications, often overlooked, face a $46 billion shortfall. In the post-pandemic era, digital infrastructure has become a core driver of economic competitiveness and innovation. Expanding broadband, 5G, and data infrastructure will be key for supporting both private industry and public services across Europe.

Global Context: Infrastructure Deficits Worldwide

Europe’s infrastructure challenges mirror broader global trends. Worldwide, roads are also the sector with the largest funding gap. Here’s how global investment needs break down by 2040:

Advertisement
Global SectorInfrastructure Gap ($ Trillion)
Road8.0
Energy2.9
Rail1.1
Telecommunications1.0
Water0.713
Ports0.555
Airports0.530

Globally, the infrastructure investment gap is expected to reach $15 trillion by 2040. The consistent need across transportation, energy, and digital sectors reflects shared global priorities for sustainable development and economic modernization.

Building for Europe’s Future

To avoid long-term economic strain and ensure resilience, European policymakers and investors must channel resources into the most underfunded sectors. Roads, railways, and energy should be at the top of the agenda, followed closely by telecom and water infrastructure. Strategic investment now can prevent far greater costs later—and help Europe maintain global competitiveness in the decades ahead.

Advertisement
Continue Reading

Economy

The Rise of India: Will It Overtake China Economically?

Published

on

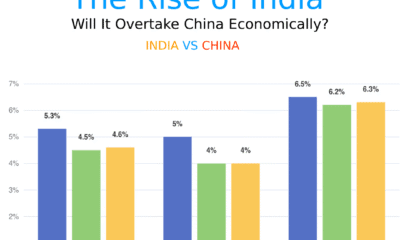
The world economy is changing fast — and two countries everyone is watching closely are India and China. For a long time, China has been known as the world’s factory and one of the fastest-growing economies. But now, its growth is starting to slow down. In 2025, China’s economy is expected to grow by just 4%.

On the other hand, India is growing much faster — with a growth rate of 6.2% expected in 2025. That’s a big difference.

India has a young population, strong tech growth, and rising local demand. All of this is helping its economy rise steadily. So the big question now is: Can India really catch up with China? And maybe even overtake it in the future?

Advertisement

India vs China: A Tale of Two Growing Giants

When we look at the numbers for 2025, it’s easy to see a big difference between how fast India and China are growing.

According to the latest data:
India’s economy is expected to grow by 6.2% in 2025
China’s economy is expected to grow by only 4%

That means India is growing faster than China, even though China still has a bigger economy overall.

Advertisement

Why India Has an Advantage

India has a younger population than China, with more than 50% of its people under 30[1]. A younger population means:

1. More people ready to work
2. More demand for goods and services
3. A strong, energetic workforce for future industries

China, in contrast, is facing an aging population crisis, which may slow down its productivity and increase healthcare and retirement costs over time.

Advertisement

What’s Helping India Grow?
India’s recent progress is driven by multiple factors:
A fast-growing digital economy with over 800 million internet users[2].
Government investments in infrastructure and manufacturing[3].
Major companies shifting supply chains to India to reduce dependence on China[4].
According to OECD, A booming startup ecosystem, especially in fintech, edtech, and health tech.

What Is Slowing China Down?
Although China remains a powerful economy, its growth is slowing due to:
* An aging workforce[5].
* Decreasing exports due to global tensions and supply chain shifts[6].
* According to CNBC, A real estate crisis that is affecting banks and households.
* Less foreign investment compared to past decades[7].

Can India Really Overtake China?
In total GDP, China is still far ahead of India. But if India keeps growing faster, it will gradually close the gap over the next 10–20 years[8]. Many analysts believe India could become the third-largest economy by 2030. With consistent policy support, tech innovation, and global interest, India has a strong chance to reshape the world economy.

India’s economy is expected to grow by 6.2% in 2025, which is a little lower than earlier estimates of 6.5%, mainly due to global problems and trade tensions, says the IMF. Still, India’s growth is stronger than most other countries in the region, thanks to rising spending in rural areas. In comparison, growth in emerging Asian countries like the ASEAN group is falling and expected to be only 4.5% in 2025 and 4.6% in 2026.

Advertisement

Last year, China’s economy grew by 5.0%, which matched the government’s goal. But new trade tariffs have started to slow things down. These tariffs reduced the benefits of strong growth at the end of 2024 and more government spending. As a result, the IMF has lowered China’s growth forecast for 2026 to 4.0%, down from 4.5%, mainly because of ongoing trade tensions and policy uncertainty.

India is no longer just an emerging country — it is becoming a key global player. With faster growth, a younger population, and growing foreign interest, it is possible that India could one day catch up or even overtake China economically.The journey won’t be easy. But the signs are clear — India is rising, and the world is watching closely.

Advertisement

References

  1. United Nations (2024). World Population Prospects 2024. [online] United Nations. Available at: https://population.un.org/wpp/.
  2. Keelery, S. (2023). India – number of internet users 2023 | Statistic. [online] Statista. Available at: https://www.statista.com/statistics/255146/number-of-internet-users-in-india/.
  3. World Bank (2024). Global Economic Prospects. [online] World Bank. Available at: https://www.worldbank.org/en/publication/global-economic-prospects.
  4. Reuters. (n.d.). Latest India News | Today’s Top Stories. [online] Available at: https://www.reuters.com/world/india/.
  5. United Nations (2024). World Population Prospects 2024. [online] United Nations. Available at: https://population.un.org/wpp/.
  6. IMF (2024). World Economic Outlook. [online] International Monetary Fund. Available at: https://www.imf.org/en/publications/weo.
  7. Bloomberg.com. (2025). China Has Record Foreign Investment Outflow as $168 Billion Exit. [online] Available at: https://www.bloomberg.com/news/articles/2025-02-14/china-has-record-foreign-investment-outflow-as-168-billion-exit.
  8. IMF (2024). World Economic Outlook, April 2024. [online] International Monetary Fund. Available at: https://www.imf.org/en/Publications/WEO/Issues/2024/04/16/world-economic-outlook-april-2024.
Continue Reading

Economy

Top Remittance-Receiving Countries in the World

Published

on

Remittances — money sent by people working abroad to their families back home — are a lifeline for millions. In 2024, these money flows reached record levels in some countries, showing how strong family bonds remain across borders.

In 2024, India became the top country in the world for receiving remittances, with around $129 billion[9] sent home by Indians living and working abroad. This shows how important family support is across borders. Mexico received $66 billion, while the Philippines got $39 billion, both ranking high on the list.

But it’s not just about the total amount for some smaller countries, remittances make up a large part of their economy. For example, Tajikistan gets 38% of its total income from money sent by its citizens working abroad. Nepal also depends heavily on remittances, which make up 25% of its GDP.

Advertisement

These money transfers help families buy food, pay school fees, and cover daily expenses. Remittances play a big role in reducing poverty and supporting economic growth in many countries. Even developed countries like France and Germany are on the list, showing how global and connected our world really is.

† All the numbers are in Billions so for example India have $129B means $129 billion remittance received by India.

At the top of the list is India, which received an incredible $129 billion, the highest in the world. Mexico comes second with $66 billion, followed by the Philippines with $39 billion. These countries have large populations working overseas, especially in the U.S., Gulf nations, and Europe.

Other countries in the top 10 include France ($36.9B), Pakistan ($34.1B), China ($29.1B), and Bangladesh ($22.1B). Interestingly, some smaller countries like Guatemala and Egypt also make the list due to the strong support from their citizens abroad. These funds help families with education, healthcare, and daily needs and in some nations, remittances are a key part of the national economy.

† Data is fetched from worldbank. Explaination: Tonga have 41.9% means 41.9% of the Tonga's GDP comes from remittance received.

Here are the top 10 countries where remittances make the biggest share of the national income in 2024.

Advertisement

Leading the list is Tajikistan, where remittances are an amazing 38.4% of its GDP! Close behind is Tonga, with nearly 42%, showing how vital this money is for their daily life. Other countries with high shares include Lebanon (30.7%), Nicaragua (26.1%), and Honduras (26%).

Countries like Nepal (25.4%), El Salvador (24%), and Lebanon show how important remittances are for supporting families and boosting local economies. Even small islands like Bermuda (21.5%) and Comoros (22.6%) rely on remittances for a big part of their GDP.

In these places, remittances don’t just help families—they’re key to the country’s survival and growth.

† Data is fetched from worldbank. Explaination: Kuwait have 0.01% means 0.01% of the Kuwait's GDP comes from remittance received.

Remittances form a small fraction of GDP in several major economies. Leading the list, Kuwait and Angola both have an extremely low remittance share of 0.01%, reflecting minimal dependence on money sent from abroad. The United States follows with only 0.03%, while Chile and Papua New Guinea register similarly low shares of 0.02% and 0.03%, respectively. Other countries with low remittance shares include Japan (0.11%), China (0.16%), Uruguay (0.17%), Cayman Islands (0.18%), and Israel (0.19%). These figures highlight limited reliance on remittances compared to countries where they play a vital economic role.

Advertisement

Here is the comprehensive data listing all countries and the remittances they have received[10][11]. This dataset provides valuable insights into the flow of remittance funds across the globe, highlighting the economic impact of money sent home by migrant workers. It covers remittance amounts and their share as a percentage of each country’s GDP, offering a detailed overview of how significant remittances are to different national economies.

Dataset of remittance-receiving countries

References

  1. United Nations (2024). World Population Prospects 2024. [online] United Nations. Available at: https://population.un.org/wpp/.
  2. Keelery, S. (2023). India – number of internet users 2023 | Statistic. [online] Statista. Available at: https://www.statista.com/statistics/255146/number-of-internet-users-in-india/.
  3. World Bank (2024). Global Economic Prospects. [online] World Bank. Available at: https://www.worldbank.org/en/publication/global-economic-prospects.
  4. Reuters. (n.d.). Latest India News | Today’s Top Stories. [online] Available at: https://www.reuters.com/world/india/.
  5. United Nations (2024). World Population Prospects 2024. [online] United Nations. Available at: https://population.un.org/wpp/.
  6. IMF (2024). World Economic Outlook. [online] International Monetary Fund. Available at: https://www.imf.org/en/publications/weo.
  7. Bloomberg.com. (2025). China Has Record Foreign Investment Outflow as $168 Billion Exit. [online] Available at: https://www.bloomberg.com/news/articles/2025-02-14/china-has-record-foreign-investment-outflow-as-168-billion-exit.
  8. IMF (2024). World Economic Outlook, April 2024. [online] International Monetary Fund. Available at: https://www.imf.org/en/Publications/WEO/Issues/2024/04/16/world-economic-outlook-april-2024.
  9. Ratha, D., Plaza, S. and Kim, E.J. (2024). In 2024, remittance flows to low- and middle-income countries are expected to reach $685 billion, larger than FDI and ODA combined. [online] World Bank Blogs. Available at: https://blogs.worldbank.org/en/peoplemove/in-2024–remittance-flows-to-low–and-middle-income-countries-ar.
  10. data.worldbank.org. (2022). Personal remittances, received (current US$) | Data. [online] Available at: https://data.worldbank.org/indicator/BX.TRF.PWKR.CD.DT.
  11. The World Bank (2019). Personal remittances, received (% of GDP) | Data. [online] Worldbank.org. Available at: https://data.worldbank.org/indicator/bx.trf.pwkr.dt.gd.zs.
Continue Reading

Trending