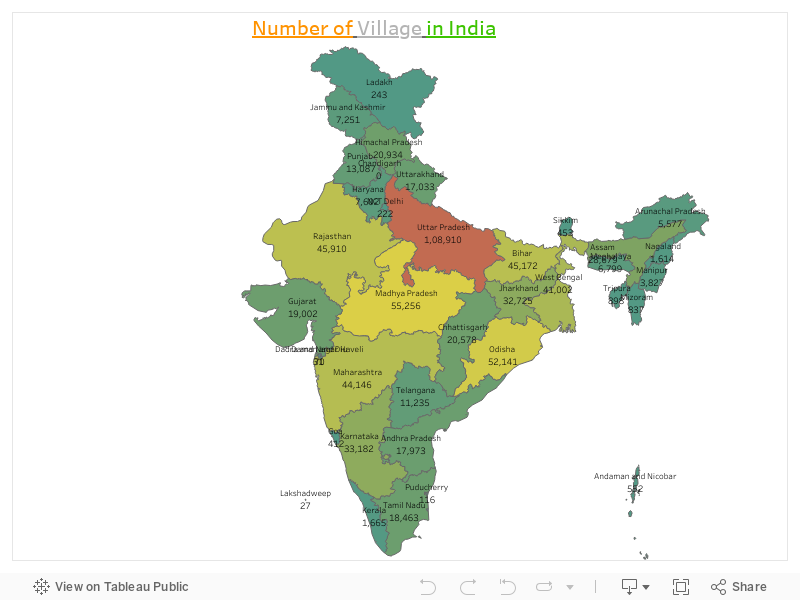
Uttar Pradesh, is called as Hub of villages because there are more than hundreds of thousand villages.
Least number of villages in the union territory of India is Lakshadweep.
There are 18 Indian States including Union Territory that have number of villages more than 10 thousands.
Introduction
Indian villages are small communities in different states of India. They are important because they have their own unique cultures, traditions and languages. Determining the precise number of villages in any state of India is a challenging task due to the vastness and dynamic nature of the country. However, it is estimated that India has a dense distribution of villages, with an average distance of approximately 5 to 10 kilometers between each village.
Fact Points
Uttar Pradesh has the most villages, with a whopping 108,910. This means there are a lot of villages in this state. Villages are the heart of livelihoods and traditions in Uttar Pradesh.
Madhya Pradesh is second on the list with 55,256 villages. That’s a large number too!
Bihar has 45,172 villages, showing that it has a lot of small communities. The majority of the population in Bihar resides in villages. Villagers also rear livestock such as cows, buffaloes, and goats. Access to basic amenities like electricity, water, and healthcare can be a challenge in some rural areas.
Odisha has 52,141 villages. That’s a high number of villages in this state. Some villages in Odisha are famous for their handicrafts. Several villages are surrounded by forests, hills, and rivers. The government is working to improve village life.
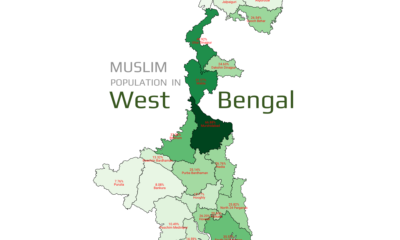
West Bengal has 41,002 villages. That’s a big number of small communities. Bengali’s in these villages mainly work in farming. They grow crops like rice, jute, and tea.
Karnataka has 33,182 villages, which is also quite a lot and vary in terms of their size, population, and economic activities. They serve as the backbone of the rural economy, with agriculture being a prominent occupation in many villages.
Rest of Villages in Indian state are mentioned in the above bar chart. It can be seen clearly how big numbers are.
Andaman and Nicobar: There are 552 villages in the Andaman and Nicobar Islands. These villages are located across the different islands and are known for their scenic beauty and rich biodiversity.
Chandigarh: Chandigarh does not have any villages as it is a well-planned city and serves as the capital of both Punjab and Haryana. It is known for its modern infrastructure and urban development.
Dadra and Nagar Haveli: Dadra and Nagar Haveli have 70 villages. These villages are nestled in the picturesque landscapes and are known for their tribal culture and traditions.
Daman and Diu: Daman and Diu have 31 villages. These villages are located along the Arabian Sea coast and are known for their beaches, historical sites, and Portuguese influence.
Jammu and Kashmir: Jammu and Kashmir have 7,251 villages. These villages are spread across the scenic valleys, mountains, and plateaus of the region and are known for their natural beauty, agriculture, and traditional way of life.
Ladakh: Ladakh has 243 villages. These villages are situated in the high-altitude desert region of the Himalayas and are known for their unique culture, Buddhist monasteries, and breathtaking landscapes.
Lakshadweep: Lakshadweep has 27 villages. These villages are located on the various islands of the archipelago and are known for their pristine beaches, coral reefs, and marine biodiversity.
NCT Delhi: Delhi, as a Union Territory, does not have traditional villages. It is a bustling metropolis and the capital of India, known for its urban development, historical landmarks, and diverse population.
Where does the Data fetch from?
Data Source:
Data for number of villages in Indian states and Union territories are fetched from OpenStreetMap. Several other information are taken from personnel research.
Excerpt:Switzerland claims the top spot in the 2024 “Best Countries” ranking by public perception, while global economic giants and rising regional players vie for influence in a list shaped by both hard metrics and subjective sentiment.
Switzerland Reigns Supreme
In the U.S. News & World Report Best Countries survey for 2024, where over 17,000 respondents evaluated 87 nations across 73 attributes, Switzerland emerged as the clear favorite. Survey participants praised its robust business environment (#2), exceptional quality of life (#3), commitment to social purpose (#7), and strong cultural influence (#8). Economically, Switzerland ranks third in GDP per capita (US $105,000) and fourth in GNI per capita (US $95,070), underlining why it resonates so strongly on the world stage [1]
Economic Titans and Entrepreneurial Leaders
Despite not topping the list, Japan and the United States secured the second and third places, respectively, buoyed by their sizeable GDPs, innovation ecosystems, and globally recognized brands. Both nations feature in the top five for entrepreneurship, with the U.S. leading in agility and power. High investor confidence and large currency reserves help offset concerns over cost of living and income inequality, demonstrating that sheer economic heft still shapes public perceptions in the survey [2]
Advertisement
Regional Shifts: Rising Powers in the Middle East and Asia
The Middle East and Asia have made notable gains, reflecting targeted investments in tourism, renewable energy, and cultural initiatives. The United Arab Emirates (17th), Qatar (25th), and Saudi Arabia (32nd) are redefining their global images beyond hydrocarbons. In Asia, South Korea (18th), Singapore (14th), and China (16th) leverage technological advances and manufacturing prowess to climb the ranks, signaling a more multipolar perception of excellence.
Global Continent Representation
How are the top 40 distributed by region? Below is a bar chart illustrating the count of best-ranked countries by continent.
The above bar chart illustrates the global continent representation among the top 40 best-ranked countries in the world. Europe leads with 17 countries, making it the most represented continent. Asia follows with 11 countries, while the Americas account for 8. Oceania and Africa each have 2 countries on the list. The chart highlights Europe’s strong global presence and shows a relatively balanced contribution from other continents, reflecting global diversity in top-performing nations.
Complete Top 40 List
The following table presents the complete dataset of the top 40 countries, as determined by the survey respondents. Rankings reflect public perception and must be understood alongside objective thresholds for GDP, tourism, and foreign direct investment inclusion [3]
Advertisement
Top 40 Best Countries in 2024
Perception Breakdown by Region
The above donut chart illustrates the continent share of the top 40 best countries in the world. Europe leads with 42.5%, followed by Asia at 27.5% and the Americas at 20%. Oceania and Africa each contribute 5%. The data highlights Europe’s dominance in global rankings, with Asia also playing a significant role. The chart visually represents how the top 40 countries are distributed across continents, emphasizing regional strengths in global development, governance, and quality of life.
How the Rankings Are Calculated
Respondents rate each country on 73 attributes grouped into 10 categories (e.g., quality of life, power, entrepreneurship). Scores for each attribute are normalized to a 0–100 scale and averaged within categories. Participants also rank category importance, which determines weighting in the final score. Only countries meeting GDP, tourism, and FDI thresholds were eligible for inclusion.
Conclusion
While Switzerland’s blend of economic strength, social well‑being, and cultural vibrancy earned it the top spot, the prominence of traditional powerhouses and emerging players underscores a dynamic global landscape. As public perceptions evolve, so too will the notion of what makes a country truly “the best.”
Advertisement
References
U.S. News & World Report. (2024). Best Countries Rankings. Available at: https://www.usnews.com/news/best-countries/rankings [Accessed 25 Jul. 2025].
U.S. News & World Report. (2024). Best Countries Subrankings. Available at: https://www.usnews.com/news/best-countries/rankings [Accessed 25 Jul. 2025].
VisualCapitalist.com. (2025). Ranked: 40 Best Countries in the World, According to People. Available at: https://www.visualcapitalist.com/ranked-40-best-countries-in-the-world-according-to-people/ [Accessed 24 Jul. 2025].
In Africa, the average working hours per week across countries are influenced by various economic, social, and cultural factors, along with differences in gender roles and labor practices.
In Nigeria, the most populous country in Africa rich in oil and diverse ethnic groups, the average workweek is 43.4 hours per week. Men work about 43.7 hours per week, while women work around 42.9 hours per week. This balance reflects the country's economic activities and labor distribution.
Advertisement
In Ethiopia, known for its ancient history and coffee, the average workweek is 30.1 hours per week. Men work around 32.7 hours per week, while women work about 27.2 hours per week, showing a significant difference likely influenced by traditional gender roles and economic structures.
Egypt, home to ancient civilizations and the pyramids, sees an average workweek of 45.5 hours per week. Men work about 46.8 hours per week, whereas women work around 39.4 hours per week, reflecting the economic pressures and societal expectations in northeastern Africa.
In the Democratic Republic of Congo, rich in natural resources and located in central Africa, the average workweek is 34.4 hours per week. Men work about 35.5 hours per week, while women work around 33.4 hours per week, reflecting a modest difference in gender work distribution.
Tanzania, known for Serengeti National Park and Mount Kilimanjaro, has an average workweek of 39.7 hours per week. Men work around 43.3 hours per week, and women work about 35.9 hours per week, showing a gender gap influenced by cultural and economic factors.
Advertisement
In South Africa, located at the southern tip of the continent, the average workweek is 41.7 hours per week. Men work about 43.8 hours per week, while women work around 39.1 hours per week, reflecting the country’s diverse economy and labor practices.
Kenya, famous for its safaris and national parks, has an average workweek of 45.1 hours per week. Men work around 47.9 hours per week, while women work about 42.2 hours per week, highlighting the demanding nature of work in East Africa.
Africa Average Workweek Data
Country
Avg hour per week (AHW)
Male (AHW)
Female (AHW)
Nigeria
43.4
43.7
42.9
Ethiopia
30.1
32.7
27.2
Egypt
45.5
46.8
39.4
DR Congo
34.4
35.5
33.4
Tanzania
39.7
43.3
35.9
South Africa
41.7
43.8
39.1
Kenya
45.1
47.9
42.2
Uganda
38.7
39.8
37.5
Sudan
39.6
41.8
33
Algeria
44
45.6
36
Morocco
43.9
46.6
34.4
Angola
39.3
41.2
37.4
Ghana
31.9
33.8
29.8
Mozambique
29.4
33.6
25.4
Madagascar
31.5
33.5
29.4
Côte d'Ivoire
44
46.3
41
Cameroon
42.5
44.6
40.1
Niger
38.9
42.8
33.4
Mali
42.4
46.4
36
Burkina Faso
43.4
46.4
39.8
Malawi
30.2
33.6
26.5
Zambia
42.4
44.5
39.8
Chad
40.4
42
38.2
Somalia
29.6
30.5
27.4
Senegal
44.2
48.3
37.7
Zimbabwe
37.1
40.5
33.6
Guinea
38.1
40.2
34.9
Rwanda
29.9
31.9
27.6
Benin
38.9
41.4
36
Burundi
39.7
41
38.4
Tunisia
43.6
44.4
41.2
South Sudan
40.1
43.7
36.5
Togo
43.4
45.1
41.5
Sierra Leone
42.6
44.8
40.3
Libya
44.8
46.9
40.7
Congo
47.9
48.3
47.5
Central African Republic
39.6
42
36.7
Liberia
48
49.6
46.2
Mauritania
38.5
38.9
37.5
Eritrea
35.3
37.7
32.5
Gambia
37.7
43.9
30.9
Botswana
43.7
46
41
Namibia
42.9
44.9
40.9
Gabon
42.3
44
39.1
Lesotho
49.5
51
47.6
Guinea-Bissau
36.4
39
33.1
Equatorial Guinea
41.6
43.7
38.7
Mauritius
39.5
40.5
37.9
Eswatini
44
46.8
40.7
Djibouti
30.6
31.7
27.5
Comoros
36.8
38.2
34.3
Cabo Verde
42.9
44.1
41.5
Sao Tome & Principe
41.4
44
35.9
Seychelles
AHW is an abbreviation for Average Hour per Week.
In Uganda, known for its diverse wildlife and Lake Victoria, the average workweek is 38.7 hours per week. Men work around 39.8 hours per week, and women work about 37.5 hours per week, showing relatively balanced gender participation in the workforce.
Advertisement
Sudan, a northeastern African country with a rich history, has an average workweek of 39.6 hours per week. Men work about 41.8 hours per week, while women work around 33 hours per week, reflecting significant gender differences in work hours.
Algeria, the largest country in Africa by land area, has an average workweek of 44 hours per week. Men work about 45.6 hours per week, whereas women work around 36 hours per week, showing a notable gender disparity influenced by cultural norms.
In Morocco, known for its rich cultural heritage and historic cities, the average workweek is 43.9 hours per week. Men work around 46.6 hours per week, while women work about 34.4 hours per week, highlighting significant gender differences in work hours.
Angola, located in southern Africa and rich in natural resources like oil and diamonds, has an average workweek of 39.3 hours per week. Men work around 41.2 hours per week, while women work about 37.4 hours per week.
Advertisement
In Ghana, known for its gold resources and vibrant culture, the average workweek is 31.9 hours per week. Men work about 33.8 hours per week, and women work around 29.8 hours per week, showing a smaller gender gap compared to other countries.
Mozambique, with its beautiful coastline and marine life, has an average workweek of 29.4 hours per week. Men work around 33.6 hours per week, while women work about 25.4 hours per week, showing one of the larger gender gaps in working hours.
In Madagascar, known for its unique biodiversity, the average workweek is 31.5 hours per week. Men work about 33.5 hours per week, while women work around 29.4 hours per week, showing a moderate gender difference.
Côte d'Ivoire, a West African country known for cocoa production, has an average workweek of 44 hours per week. Men work about 46.3 hours per week, whereas women work around 41 hours per week, reflecting high work demands in agriculture and trade.
Advertisement
In Cameroon, with diverse landscapes and cultural heritage, the average workweek is 42.5 hours per week. Men work around 44.6 hours per week, while women work about 40.1 hours per week.
Niger, known for its desert landscapes and rich cultural traditions, has an average workweek of 38.9 hours per week. Men work around 42.8 hours per week, while women work about 33.4 hours per week, reflecting traditional gender roles.
In Mali, known for its music and historical sites, the average workweek is 42.4 hours per week. Men work around 46.4 hours per week, whereas women work about 36 hours per week, indicating significant gender differences.
Burkina Faso, known for its vibrant arts scene and cultural festivals, has an average workweek of 43.4 hours per week. Men work around 46.4 hours per week, while women work about 39.8 hours per week, highlighting the gender gap.
Advertisement
In Malawi, known for its lake and friendly people, the average workweek is 30.2 hours per week. Men work around 33.6 hours per week, while women work about 26.5 hours per week, showing a large gender difference in work hours.
Zambia, known for its natural beauty and Victoria Falls, has an average workweek of 42.4 hours per week. Men work around 44.5 hours per week, while women work about 39.8 hours per week.
In Chad, known for its desert landscapes, the average workweek is 40.4 hours per week. Men work about 42 hours per week, whereas women work around 38.2 hours per week.
Somalia, located in the Horn of Africa, has an average workweek of 29.6 hours per week. Men work around 30.5 hours per week, while women work about 27.4 hours per week, reflecting economic challenges and traditional roles.
Advertisement
In Senegal, known for its music and vibrant cultural festivals, the average workweek is 44.2 hours per week. Men work around 48.3 hours per week, while women work about 37.7 hours per week, highlighting significant gender differences.
Zimbabwe, known for Victoria Falls and diverse wildlife, has an average workweek of 37.1 hours per week. Men work around 40.5 hours per week, while women work about 33.6 hours per week.
In Guinea, known for its natural resources and musical heritage, the average workweek is 38.1 hours per week. Men work around 40.2 hours per week, while women work about 34.9 hours per week.
Rwanda, known for its mountainous landscape and wildlife, has an average workweek of 29.9 hours per week. Men work around 31.9 hours per week, while women work about 27.6 hours per week, reflecting balanced gender participation.
Advertisement
In Benin, known for its rich history and cultural heritage, the average workweek is 38.9 hours per week. Men work around 41.4 hours per week, while women work about 36 hours per week.
Burundi, known for its hills and tea plantations, has an average workweek of 39.7 hours per week. Men work around 41 hours per week, while women work about 38.4 hours per week.
In Tunisia, known for its Mediterranean coastline and ancient ruins, the average workweek is 43.6 hours per week. Men work around 44.4 hours per week, while women work about 41.2 hours per week.
South Sudan, the youngest country in the world, has an average workweek of 40.1 hours per week. Men work around 43.7 hours per week, while women work about 36.5 hours per week.
Advertisement
In Togo, known for its palm-lined beaches and hilltop villages, the average workweek is 43.4 hours per week. Men work around 45.1 hours per week, while women work about 41.5 hours per week.
Sierra Leone, known for its tropical rainforest and coastline, has an average workweek of 42.6 hours per week. Men work around 44.8 hours per week, while women work about 40.3 hours per week.
In Libya, with its vast deserts and rich history, the average workweek is 44.8 hours per week. Men work around 46.9 hours per week, while women work about 40.7 hours per week.
Congo, known for its rainforests and diverse wildlife, has an average workweek of 47.9 hours per week. Men work around 48.3 hours per week, while women work about 47.5 hours per week, reflecting high labor demands.
Advertisement
In the Central African Republic, known for its diverse wildlife and cultures, the average workweek is 39.6 hours per week. Men work around 42 hours per week, while women work about 36.7 hours per week.
Liberia, known for its history and beautiful coastline, has an average workweek of 48 hours per week. Men work around 49.6 hours per week, while women work about 46.2 hours per week.
Mauritania, with its vast deserts and rich cultural traditions, has an average workweek of 38.5 hours per week. Men work around 38.9 hours per week, while women work about 37.5 hours per week.
In Eritrea, known for its Red Sea coastline and history, the average workweek is 35.3 hours per week. Men work around 37.7 hours per week, while women work about 32.5 hours per week.
Advertisement
Gambia, known for its river and cultural heritage, has an average workweek of 37.7 hours per week. Men work around 43.9 hours per week, while women work about 30.9 hours per week.
In Botswana, known for its wildlife and Okavango Delta, the average workweek is 43.7 hours per week. Men work around 46 hours per week, while women work about 41 hours per week.
Namibia, known for its Namib Desert and diverse wildlife, has an average workweek of 42.9 hours per week. Men work around 44.9 hours per week, while women work about 40.9 hours per week.
In Gabon, with its rich biodiversity and oil resources, the average workweek is 42.3 hours per week. Men work around 44 hours per week, while women work about 39.1 hours per week.
Advertisement
Lesotho, known for its high altitude and mountainous terrain, has the highest average workweek of 49.5 hours per week. Men work around 51 hours per week, while women work about 47.6 hours per week.
In Guinea-Bissau, known for its national parks and diverse wildlife, the average workweek is 36.4 hours per week. Men work around 39 hours per week, while women work about 33.1 hours per week.
Equatorial Guinea, with significant oil reserves and a unique cultural heritage, has an average workweek of 41.6 hours per week. Men work around 43.7 hours per week, while women work about 38.7 hours per week.
In Mauritius, known for its beaches and diverse cultures, the average workweek is 39.5 hours per week. Men work around 40.5 hours per week, while women work about 37.9 hours per week.
Advertisement
Eswatini, known for its nature reserves and culture, has an average workweek of 44 hours per week. Men work around 46.8 hours per week, while women work about 40.7 hours per week.
Djibouti, known for its strategic location and port, has an average workweek of 30.6 hours per week. Men work around 31.7 hours per week, while women work about 27.5 hours per week.
In Comoros, known for its volcanic islands and culture, the average workweek is 36.8 hours per week. Men work around 38.2 hours per week, while women work about 34.3 hours per week.
Cabo Verde, known for its Creole culture, has an average workweek of 42.9 hours per week. Men work around 44.1 hours per week, while women work about 41.5 hours per week.
Advertisement
In São Tomé and Príncipe, known for its biodiversity and coffee, the average workweek is 41.4 hours per week. Men work around 44 hours per week, while women work about 35.9 hours per week.
Lastly, Seychelles, known for its beaches and marine life, does not have available data for average work hours per week, reflecting its unique economic and labor conditions.
Overall, these differences in average work hours per week across African countries are shaped by a blend of economic demands, cultural norms, and gender roles, with significant variations between men and women’s work hours highlighting the impact of traditional and economic factors.
In South Asia, the average number of hours people work each week varies greatly due to a combination of economic conditions, cultural norms, labor laws, and gender roles.
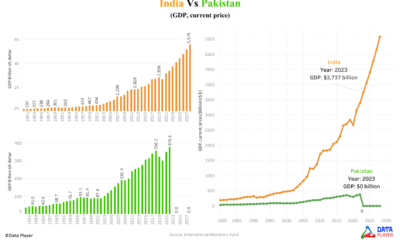
In India, the average workweek is 46 hours. The economy is diverse, with a significant portion of the workforce in the informal sector, leading to longer working hours. Men work about 49.9 hours per week, while women work around 36 hours. Traditional views that men are the primary breadwinners mean men often work longer hours, while women balance household responsibilities with their jobs, resulting in shorter official working hours but significant unpaid labor at home.
Advertisement
In Pakistan, the average workweek is 46.6 hours. Similar to India, a large informal sector results in longer working hours. Men work about 50.3 hours per week, whereas women work around 34.2 hours due to domestic responsibilities and societal norms limiting their workforce participation.
In Bangladesh, the average workweek is 45.8 hours. The growing economy, especially in the garment industry, necessitates long hours. Men work about 49.9 hours per week, and women work around 36.9 hours, balancing work with household duties, leading to shorter official working hours.
In Nepal, the average workweek is 39.7 hours. The mixed economy, with a significant agricultural component, results in varied working hours. Men work around 42.6 hours per week, while women work about 34.7 hours, often engaging in considerable unpaid work at home.
South Asia Average Workweek Data
Country
Avg hour per week (AHW)
Male (AHW)
Female (AHW)
India
46
49.9
36
Pakistan
46.6
50.3
34.2
Bangladesh
45.8
49.9
36.9
Nepal
39.7
42.6
34.7
Bhutan
54.3
55
53.5
Maldives
45.2
48.9
35.8
Afghanistan
38.3
39.6
15.8
Sri Lanka
41.2
43.6
36.2
AHW is an abbreviation for Average Hour per Week.
Advertisement
Bhutan stands out with the highest average workweek of 54.3 hours, reflecting greater gender equality and cultural acceptance of long work hours. Men work about 55 hours per week, and women work around 53.5 hours.
In the Maldives, the average workweek is 45.2 hours. The tourism-driven economy with seasonal fluctuations affects working hours, with men working about 48.9 hours per week during peak seasons. Women work around 35.8 hours due to traditional roles and domestic responsibilities.
In Afghanistan, the average workweek is 38.3 hours. The war-torn economy and many people engaged in informal work see men working about 39.6 hours per week. Strict cultural norms heavily restrict women’s participation in the workforce, resulting in very low working hours for women, around 15.8 hours.
In Sri Lanka, the average workweek is 41.2 hours. The diverse economy leads to varying working hours across different sectors. Men work about 43.6 hours per week, while women work around 36.2 hours, performing a significant amount of unpaid domestic work.
Advertisement
Overall, in South Asian countries, economic conditions, the prevalence of informal sectors, cultural expectations, and the enforcement of labor laws play crucial roles in determining working hours. Traditional gender roles typically see men working longer hours outside the home, while women balance official work with substantial unpaid labor at home, leading to notable gender disparities in workforce participation.


 Technology2 years ago