
Economy
Why Pakistan’s economy is drowning while India’s economy is touching the sky
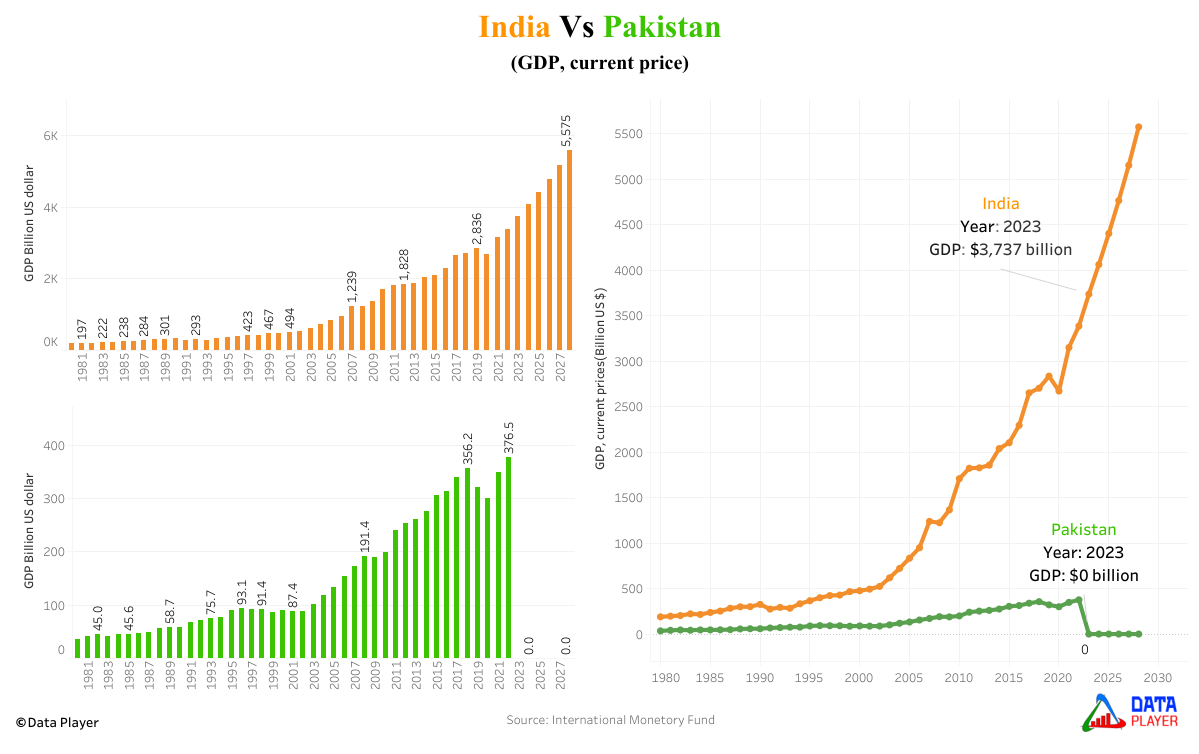
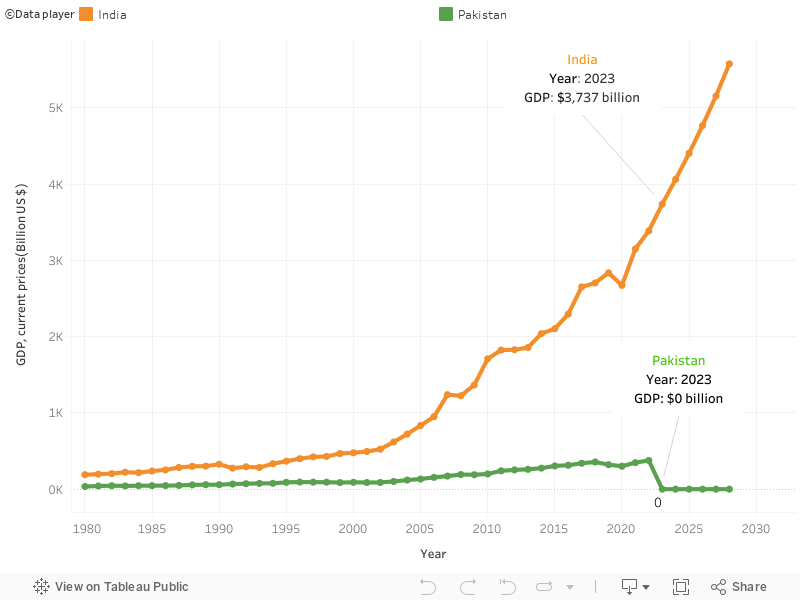
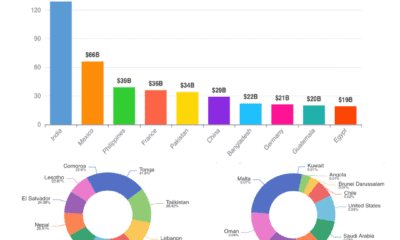
The 2023 biggest Crisis of the economy in South Asia is going on in Pakistan that has never seen such a disaster since it became apart from India(Hindustan) in august 1947 and drew a thick political border. Several challenges have occurred for the Pakistani residents in order to survive as basic food(Ata flour, rice, and vegetables), oil and gas prices are touching the sky. However, it has been perceived that those basic nourishment have 3 times lower cost in India and are affordable to Indian people. GDP nominal of India is 3700 billion dollar in 2023 while Pakistan represents almost zero billion dollar in its GDP. Moreover, liabilities and external debt that Pakistan holds as of december 2022 is $126 billion.
Impact of trade relation between India and Pakistan on Pakistan’s economy
The geographical link between India and Pakistan is the only Wagah border which lies on a grand trunk road and connects from Amritsar to Lahore. Punjab, Rajasthan, Gujarat and Jammu & Kashmir are the four states of India which share their boundary with Punjab(Pakistan), Sind(Pakistan) and POJK(Pakistan occupied Jammu Kashmir).
Over the past 75 years, these two nations which are also known as nuclear power countries have fought war about three times 1947, 1965 and 1999 only for the territory of Kashmir. And this is the primary cause of the worst trade relation between both the countries. Till 1956, India was Pakistan’s largest trading partner but just after that it started fluctuating and the war happened in 1971 which created Bangladesh as a separate state from Pakistan. The trade has completely halted between both the nations after the reorganisation act 2019 of Jammu & Kashmir. In 2018, GDP(nominal) of Pakistan was 356 billion US dollar while it dropped to 321 billion US dollar in 2019 and kept down till 300 billion US dollar in 2020. However, the economy of Pakistan became almost zero in 2023. Pakistan is still doing trade with India but through third countries especially via the United Arab Emirates which led to a hike in every product’s prices in Pakistan. For instance, if tomatoes are 20 rupees per kg in India, suppose after tax the price becomes 40 rupees per kg in UAE. Now when Pakistan is buying tomatoes from the UAE it will cost 60 rupees per kg after tax.
GDP of India Vs Pakistan from 1980 to 2028 dataset
Conclusion
Pakistan’s economy started dying at the end of 2022 and the crisis has completely gripped all over the land. People of Pakistan are facing extreme poverty these days because prices of every goods have kept increasing. The value of Pakistani rupees has become valueless where rate of $1 = 300 PKR however rate of $1 is just 82 Indian rupee(INR). There is no comparison of economy between India and Pakistan even though both nations started growing since 1947. India has achieved $3,737 billion in its economy and is predicted to become $5,575 billion in 2028 while no prediction can be made about Pakistan’s economy. Inflation rate in Pakistan has hit 38% as of May 2023 and made the highest record in South Asia.
Where does the Data fetch from?
Data Source: Data for GDP are fetched from International Monetary Fund(IMF)” from the year 1980 to 2028(future). Several information are taken from Wikipedia, USIP, Le Monde, High commission of India, The print and Live mint.


Economy
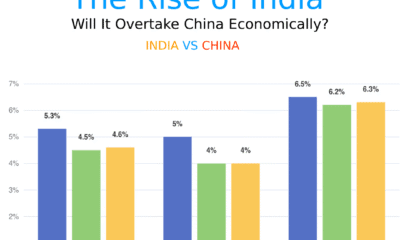
Is India Really a ‘Dead Economy’? A Deep Dive Into the Facts Trump Didn’t Mention
When Donald Trump recently called India a “dead economy,” it sparked global headlines and trended across social media. For many, this bold remark raised questions — is there any truth to it? Is India really falling behind, or is something else happening beneath the surface?
References
- Wikipedia. Tariffs in the Second Trump Administration. Available at: https://en.wikipedia.org/wiki/Tariffs_in_the_second_Trump_administration
- Times of India. India-US trade deal: Trump announces 25% tariff on India. Available at: https://timesofindia.indiatimes.com/business/india-business/india-us-trade-deal-trump-announces-25-tariff-on-india-plus-penalty-for-buying-energy-and-arms-from-russia/articleshow/122998698.cms
- Reuters. Trump imposes extra 25% tariff on Indian goods. Available at: https://www.reuters.com/world/india/trump-imposes-extra-25-tariff-indian-goods-ties-hit-new-low-2025-08-06/
- IndiaTimes. Donald Trump’s India tariffs set to hit US shoppers hard. Available at: https://indiatimes.com/trending/donald-trumps-india-tariffs-set-to-hit-us-shoppers-hard-phones-auto-parts-jeans-jewellery-to-get-costlier-665564.html
- Al Jazeera. Trump imposes 25 percent tariff on Indian goods over Russian oil. Available at: https://www.aljazeera.com/news/2025/8/6/trump-imposes-25-percent-tariff-on-indian-goods-over-russian-oil
- Economic Times. India reacts to 50% US tariffs. Available at: https://economictimes.indiatimes.com/news/economy/foreign-trade/trump-tariff-from-50-on-india-and-brazil-to-35-on-canada-heres-how-nations-stack-up-in-comparison/articleshow/123145315.cms
- Khandekar, N. (2025). India to remain fastest growing major eco with 6.5% growth in FY26: IMF. [online] The Economic Times. Available at: https://economictimes.indiatimes.com/news/economy/indicators/india-to-remain-fastest-growing-major-eco-with-6-5-growth-in-fy26-imf/articleshow/118649360.cms.
- World Bank (2023). Population, Total. [online] The World Bank. Available at: https://data.worldbank.org/indicator/SP.POP.TOTL.
- CIA (2024). Median age – The World Factbook. [online] www.cia.gov. Available at: https://www.cia.gov/the-world-factbook/field/median-age/country-comparison/.
- UN Comtrade. (2024). Available at: https://comtrade.un.org [Accessed 25 Jul. 2025].
- ITC Trade Map. (2024). Available at: https://www.trademap.org [Accessed 22 Jul. 2025].

Muslim Population in Goa (2025 Update): District-Wise Data, Percentage & Analysis

Muslim Population in Telangana (2025 Update): District-Wise Data, Percentage & Analysis

Muslim Population in Karnataka (2025 Update): District-Wise Data, Percentage & Analysis

Trump’s 2025 Tariffs on India Explained: Full List, Dates, Products, and 50% Duty Impact

Muslim Population in Odisha (2025 Update): District-Wise Data, Percentage & Analysis
Muslim Population in Goa (2025 Update): District-Wise Data, Percentage & Analysis
Muslim Population in Telangana (2025 Update): District-Wise Data, Percentage & Analysis
Muslim Population in Karnataka (2025 Update): District-Wise Data, Percentage & Analysis


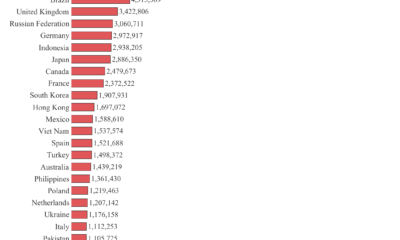
 Technology2 years ago
Highest number of software developers by country in the world 2023 by GitHub | Data Player
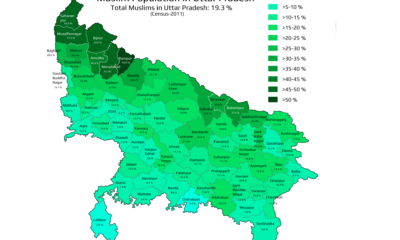
- Religion2 years ago
Mapped: What are the muslims population in Uttar Pradesh | State of India
- Demographics2 years ago
Mapped: Average Working Hours by European Countries in 2024
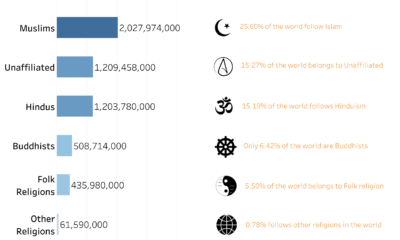
- Religion2 years ago
World’s Largest Religion in 2024 | Data Player
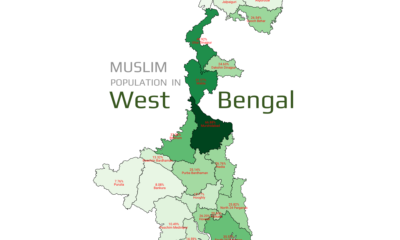
- Religion2 years ago
Mapped: What is Muslim Population in West Bengal by District wise 2011
- Demographics3 years ago
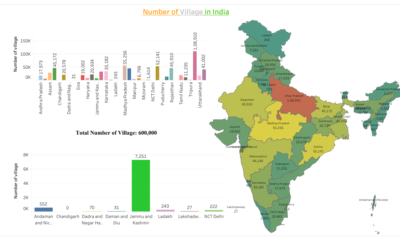
What are the Number of Villages in India by its State and Union Territory
- Demographics3 years ago
Massive population size by Indian states 2023
- Population2 years ago
Muslim Population in London 2021 by Constituency: A Visual Guide